Imagine two countries.
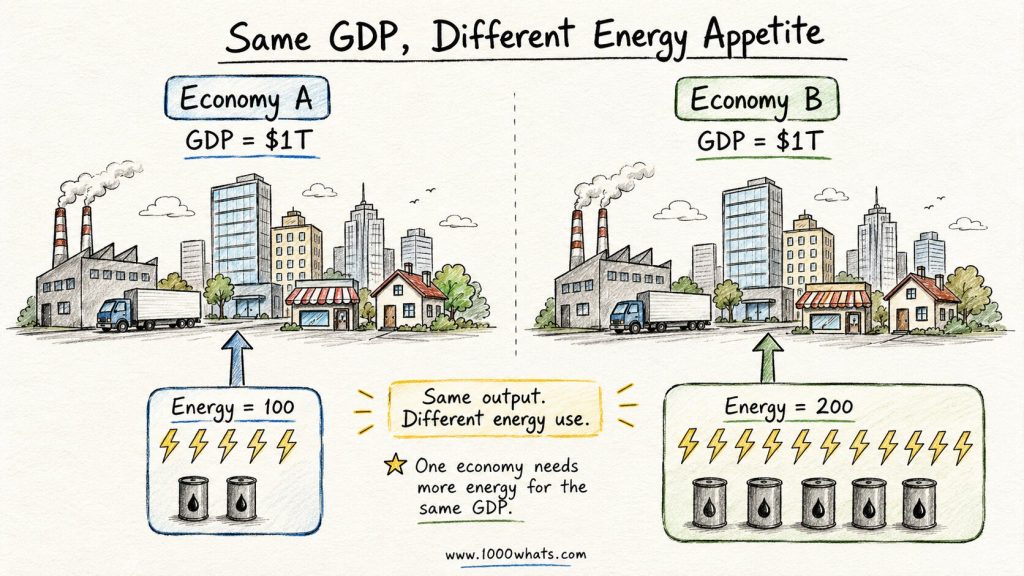
Both produce $1 trillion of economic output.
Country A uses 100 units of energy to do it.
Country B uses 200.
Same economic output.
Twice the energy.
Something interesting is hiding in that difference.
Maybe Country A has more efficient factories.
Maybe its buildings are better insulated.
Maybe people drive more efficient cars.
Maybe Country B makes steel, cement and chemicals while Country A makes software and financial services.
Maybe Country A simply has warmer winters.
Or maybe all of those things are happening at once.
Welcome to 1000whats — where today we’re dividing one enormous number by another enormous number and discovering that the answer is much more interesting than it has any right to be.
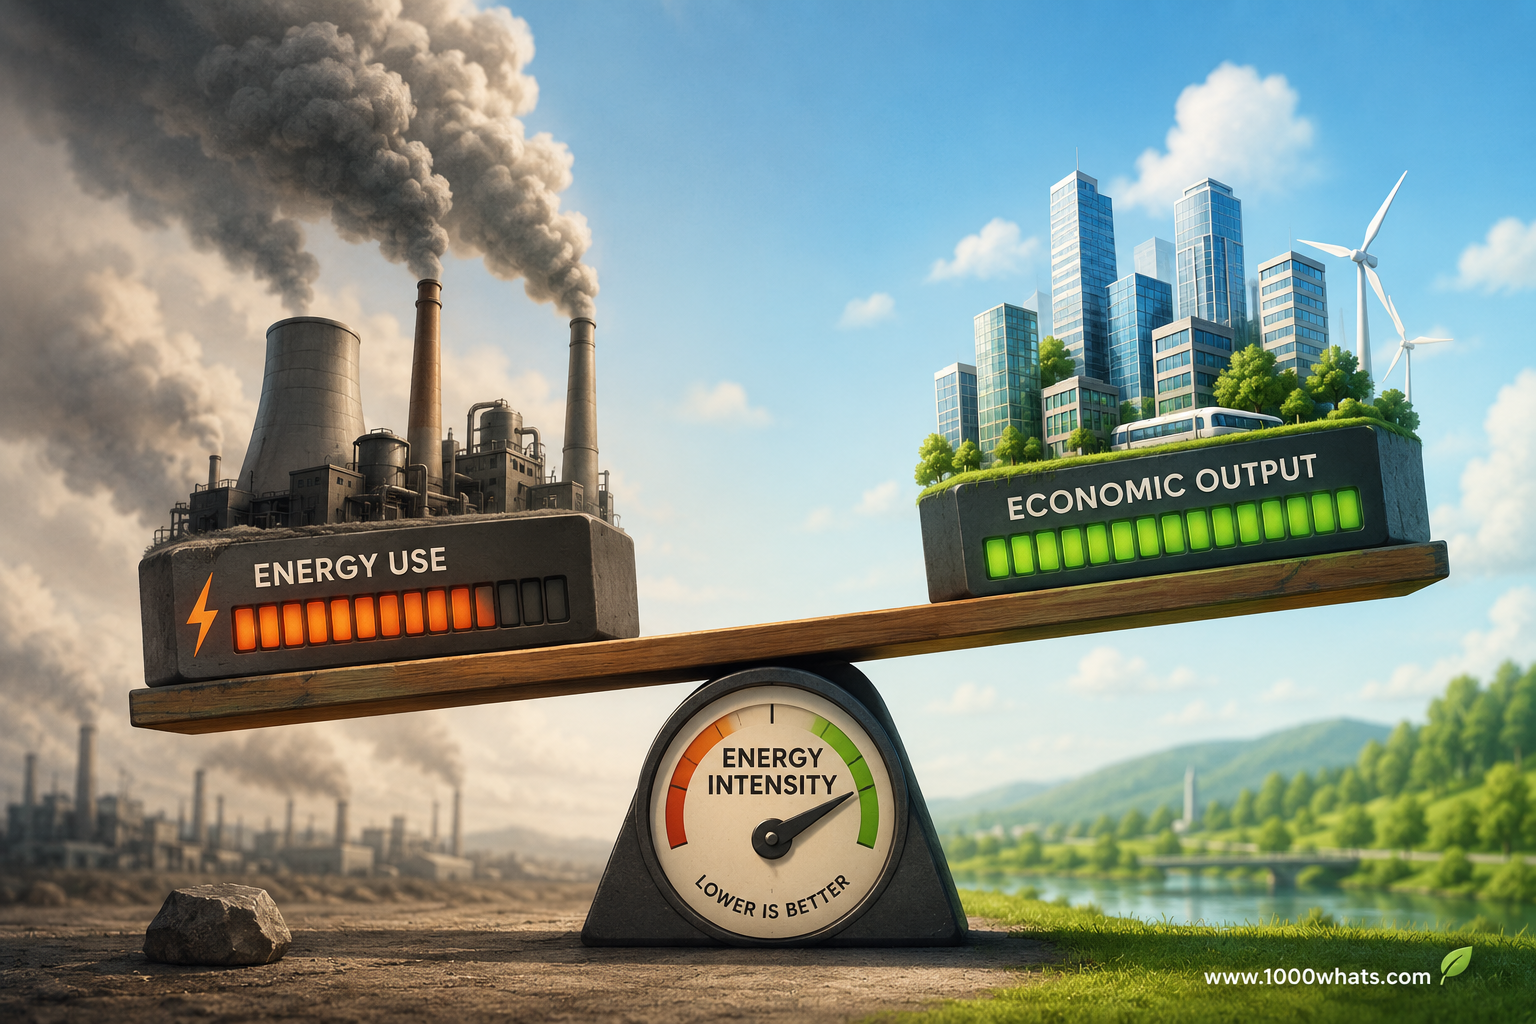
That ratio is called energy intensity.
⚡ “Energy intensity tells you how energy-hungry an economy is. It does not automatically tell you why.”
And that second sentence is where the real story begins.
So, what is energy intensity?
At its simplest:
Energy intensity measures how much energy is used to produce a unit of economic output.
At the national level, the basic relationship is:
Energy intensity = Energy use / GDP
Suppose an economy uses:
5 exajoules of energy
to produce:
$1 trillion of GDP.
Its energy intensity is simply the amount of energy associated with producing each unit of that economic output.
The IEA uses primary energy intensity as a major indicator of global energy-efficiency progress, calculated from total energy supply relative to GDP adjusted for purchasing power parity.
The number itself matters less than the direction.
If GDP grows faster than energy consumption, energy intensity falls.
If energy consumption grows faster than GDP, energy intensity rises.
So when analysts say:
“Global energy intensity improved by 2%”
they generally mean:
the world used about 2% less energy per unit of economic output than before.
Not that total energy use necessarily fell.
That distinction matters enormously.
Wait—an economy can use more energy and become less energy-intensive?
Absolutely.
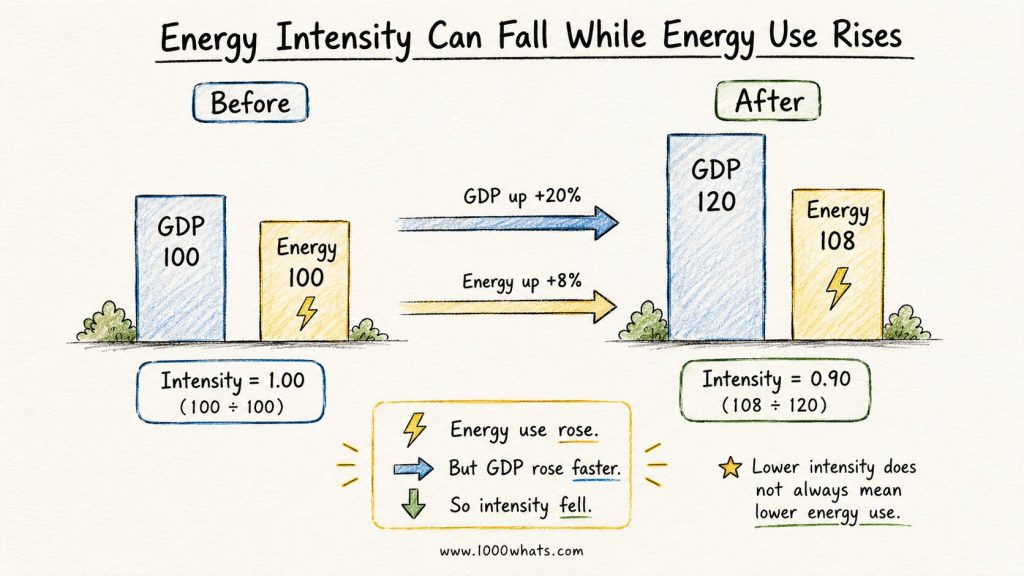
Suppose our imaginary economy starts here:
| Year | GDP | Energy use | Energy intensity |
|---|---|---|---|
| Year 1 | $100 | 100 units | 1.00 |
| Year 2 | $120 | 108 units | 0.90 |
Energy consumption increased from 100 to 108.
But GDP increased faster—from 100 to 120.
So the economy now uses less energy for every unit of output it produces.
Total energy use went up.
Energy intensity went down.
There is no contradiction.
This is one reason energy headlines can become confusing very quickly.
“Energy demand increased” and “energy intensity improved” can both be true at exactly the same time.
One measures the size of the energy appetite.
The other measures the appetite relative to economic output.
Why did anyone invent this metric?
Because comparing raw energy consumption between economies tells us surprisingly little.
The United States will obviously consume more energy than Luxembourg.
It has vastly more people, factories, vehicles, buildings and economic activity.
Likewise, an economy can consume more energy this decade simply because it has become larger.
So analysts need a way to ask a more useful question:
How much energy does the economy need relative to what it produces?
Energy intensity normalizes energy consumption against economic activity.
That lets us compare:
- one country with another;
- one period with another;
- sectors within an economy;
- progress over time.
The same idea can be applied below the national level.
In industry, for example, energy intensity might be expressed as energy consumed per unit of industrial value added.
In transport, analysts can look at energy per passenger-kilometer.
In freight, energy per tonne-kilometer.
In buildings, energy per square meter.
The denominator changes.
The question remains essentially the same:
How much energy does it take to do the thing we are measuring?
Energy intensity is not energy efficiency
This is the distinction worth remembering.
Suppose Country A has an economy dominated by:
software,
banking,
tourism,
professional services,
and technology companies.
Country B produces:
steel,
cement,
aluminum,
chemicals,
glass,
and fertilizers.
Country B will probably have much higher energy intensity.
Does that automatically mean its steel mills are horribly inefficient?
No.
Its economy simply does different things.
A steel mill requires enormous amounts of energy because making steel is an energy-intensive physical process.
An accountant with a laptop generally does not require a blast furnace.
This means an economy can lower its energy intensity without making a single machine more efficient.
Imagine Country B closes half its steel industry and begins importing steel instead.
Domestic energy consumption falls.
GDP may remain relatively strong.
Energy intensity improves.
Fantastic?
Perhaps statistically.
But the steel still has to be made somewhere.
We may have moved the energy consumption across a border rather than eliminated it.
⚡ “A falling energy-intensity number can mean better technology. It can also mean somebody moved the factory.”
This is why the IEA explicitly cautions that aggregate energy intensity is a proxy for efficiency, not a perfect measurement of it. Climate, economic structure and other factors can materially affect the result.
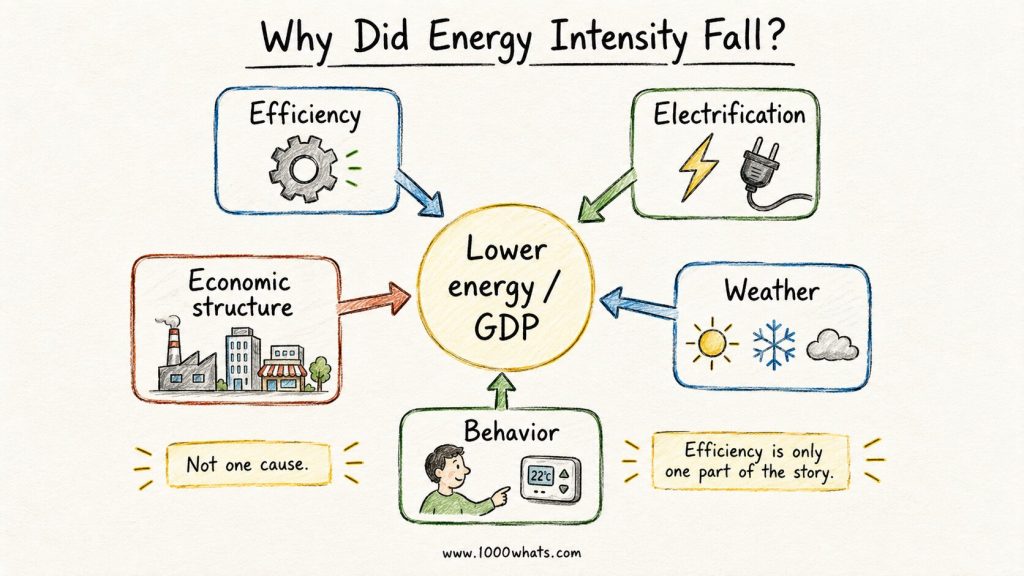
So what actually makes energy intensity fall?
Several things can do it.
Better efficiency
This is the obvious one.
A modern industrial motor may perform the same work using less electricity.
A better-insulated building needs less heat.
An efficient car needs less fuel to travel the same distance.
An LED produces the same useful light with much less electricity than an incandescent bulb.
This is genuine technical efficiency.
And it pushes energy intensity downward.
Electrification
Now things get more interesting.
An electric motor can convert electricity into mechanical work much more efficiently than an internal-combustion engine converts fuel into motion.
Heat pumps can deliver several units of heat for each unit of electricity they consume because they move ambient heat rather than creating all of it through combustion.
So replacing combustion technologies with electric ones can reduce the amount of energy required to provide the same service.
That can lower energy intensity.
This connects directly to our explainer on energy efficiency.
Structural change
Suppose an economy gradually moves from heavy manufacturing toward services.
Steel production falls.
Software, finance and professional services grow.
GDP can continue increasing while energy demand grows much more slowly—or even falls.
Energy intensity improves.
But that improvement did not necessarily come from more efficient technology.
The economy changed what it produces.
Weather
A warm winter can reduce heating demand substantially.
GDP barely notices.
Energy intensity falls.
Did every boiler suddenly become more efficient?
Obviously not.
The weather helped.
Behavioral and activity changes
People may drive less.
Factories may operate fewer hours.
Buildings may lower thermostats.
Production patterns may change.
All can affect energy consumption relative to GDP.
That is why interpreting energy intensity requires more than admiring a downward-sloping chart.
A country can become more efficient while its energy intensity gets worse
Now let’s flip the problem around.
Suppose a developing economy builds new:
steel plants,
cement factories,
chemical plants,
railways,
data centers,
and manufacturing facilities.
At the same time, every new factory is more efficient than the old technology it replaces elsewhere.
Technical efficiency improved.
But the economy has also become much more industrial.
Its total energy demand may grow faster than GDP.
Energy intensity can therefore stagnate or even increase.
Did efficiency fail?
No.
Structural change overwhelmed the efficiency improvement.
This is why serious energy analysis often decomposes changes in consumption into several effects.
The IEA’s energy-efficiency indicator work separates drivers such as:
activity, structure and efficiency.
That is much more informative than looking at the headline ratio alone.
Think of it like fuel consumption for an economy
There is a useful analogy.
Imagine two cars.
Car A uses:
5 liters per 100 km.
Car B uses:
10 liters per 100 km.
The first car has lower fuel intensity per kilometer traveled.
Energy intensity does something similar for an economy.
Instead of:
liters / kilometer
we have roughly:
energy / economic output.
But the analogy has a flaw.
Two cars are doing approximately the same job.
Two national economies may not be.
One may manufacture aircraft and aluminum.
The other may sell software subscriptions and financial advice.
Comparing their energy intensity as if it were a clean efficiency ranking would therefore be misleading.
The ratio is useful.
The interpretation requires context.
What does “energy intensity improved” actually mean?
This wording causes unnecessary confusion because an “improvement” means the number falls.
Lower intensity = less energy per unit of output.
So:
energy intensity ↓ = improvement
energy intensity ↑ = deterioration
If an economy goes from:
5 MJ per dollar of output
to:
4.5 MJ per dollar
energy intensity improved by 10%.
The economy now needs less energy for each unit of economic value it produces.
This is why IEA charts often show the rate of energy-intensity improvement as a positive percentage even though the underlying intensity itself is declining.
Energy statistics occasionally enjoy making perfectly sensible things look backwards.
How much has global energy intensity actually improved?
Quite a lot over the long run.
The IEA’s 2026 policy assessment says global energy use has become substantially more efficient since 2000, with energy intensity improving by roughly 30% over the past 25 years.
That means the world now uses around 30% less energy per unit of economic output than it did at the beginning of the century.
That is enormous.
Imagine producing today’s global economy using the energy intensity of 2000.
Energy demand would be dramatically higher.
But there is a problem.
The pace of improvement has slowed.
The IEA estimates the annual improvement rate fell from around 2.2% in the early 2010s to about 1% in 2024.
Its Energy Efficiency 2025 assessment estimated an improvement of around 1.8% in 2025—better, but still well below the roughly 4% annual improvement associated with the global COP28 ambition for 2030.
So we are getting better at producing economic activity with less energy.
Just not quickly enough to meet current global efficiency ambitions.
Why does a boring ratio matter so much?
Because energy intensity sits at the intersection of several enormous problems.
Imagine GDP growing by 3% every year.
If energy intensity does not improve, energy demand tends to rise roughly alongside economic activity, all else equal.
That means more:
generation,
fuel,
transmission,
storage,
infrastructure,
investment.
Now imagine energy intensity falls 2% per year while GDP grows 3%.
Energy demand might grow only around 1%, before considering other effects.
Push intensity improvements further and economic output can grow while energy demand barely moves.
That is extremely powerful.
It means economic growth does not have to translate one-for-one into energy growth.
And because much of the world’s energy system still involves fossil fuels, lower energy requirements can also make decarbonization easier.
You have fewer dirty joules to replace.
This is where decoupling enters the room
Energy intensity is closely related to an idea called decoupling.
Suppose GDP rises.
Energy consumption rises more slowly.
Economic growth and energy demand are becoming relatively decoupled.
If GDP rises while energy consumption actually falls, the separation becomes stronger.
This is one reason policymakers obsess over energy-intensity improvements.
A growing economy usually wants:
more homes,
more mobility,
more industrial output,
more cooling,
more digital services,
higher living standards.
Simply telling everyone to stop doing things is not a particularly durable energy strategy.
The more interesting option is to make the relationship between economic activity and energy demand weaker.
More value from each unit of energy.
That is essentially what declining energy intensity describes.
But GDP makes the whole thing slightly weird
There is another problem hiding in the denominator.
GDP measures economic value.
It does not measure physical output directly.
Suppose the price or economic value of a country’s services rises significantly.
GDP increases.
Physical energy use remains unchanged.
Measured energy intensity falls.
Or imagine a factory switches from producing cheap bulk materials to expensive specialized products using similar amounts of energy.
Again, energy intensity may improve because the economic value in the denominator increased.
This is one reason sector-level physical indicators can sometimes tell us more about actual efficiency.
Instead of:
energy / dollars
we can measure:
energy / tonne of steel
energy / square meter of building
energy / passenger-kilometer
energy / tonne-kilometer of freight
These measures get closer to the physical service being provided.
The further down we drill, the better we can separate real technical efficiency from changes in prices, economic structure and activity.
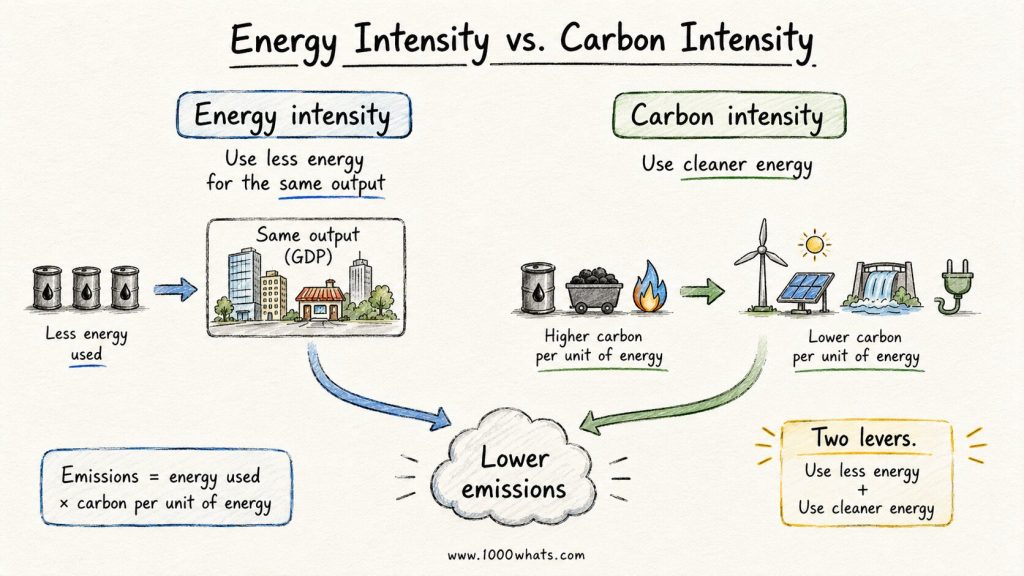
Energy intensity vs. carbon intensity
These two are also easy to confuse.
Energy intensity asks:
How much energy is used per unit of output?
Carbon intensity asks:
How much CO₂ is emitted per unit of something—often electricity, energy or GDP?
They can move independently.
Imagine a steel plant switches from coal-heavy electricity to low-carbon electricity but uses exactly the same amount of energy.
Energy intensity:
unchanged.
Carbon intensity:
falls.
Now imagine the plant installs dramatically more efficient equipment but still uses coal-based energy.
Energy intensity:
falls.
Carbon intensity may also fall, but for a different reason: less energy is required.
Deep decarbonization often needs both.
Use less energy for the same service.
And:
make the remaining energy cleaner.
Those are related jobs.
They are not the same job.
Can low energy intensity be bad?
Not inherently.
But the number needs interpretation.
A country experiencing a severe recession may see industrial production collapse.
Factories close.
Energy demand falls.
Depending on what happens to GDP, energy intensity may improve.
That does not mean policymakers should celebrate the world’s greatest efficiency program.
Likewise, deindustrialization can lower domestic energy intensity while increasing reliance on imported energy-intensive products.
The atmosphere does not care which country’s spreadsheet contains the emissions.
So when comparing energy intensity, always ask:
- Did technology become more efficient?
- Did the economy change structure?
- Did production move abroad?
- Did weather change?
- Did activity fall?
- Did electrification reduce energy requirements?
- Are we comparing economies with similar industrial structures?
Without those questions, energy intensity can become another number people use to prove whatever they already wanted to believe.
Energy intensity and energy productivity are basically mirror images
You may also encounter energy productivity.
The concept simply turns the ratio around.
Energy intensity asks:
How much energy do we need for each unit of output?
Energy productivity asks:
How much economic output do we get from each unit of energy?
So:
Energy intensity = Energy / GDP
while:
Energy productivity = GDP / Energy
Lower energy intensity is good.
Higher energy productivity is good.
Same relationship.
Different camera angle.
If energy intensity is liters per 100 kilometers, energy productivity is kilometers per liter.
Energy people apparently needed both.
We like ratios.
What most people don’t see: This metric sits behind huge policy targets
Energy intensity sounds like something destined to live quietly inside an Excel sheet.
It doesn’t.
The United Nations uses primary energy intensity to track Sustainable Development Goal 7.3, the global objective to improve energy efficiency.
How do we track whether the world is moving in that direction?
Primarily through changes in primary energy intensity.
That means this slightly awkward ratio sits behind one of the world’s major energy-policy commitments.
Not bad for division.
So, what is energy intensity in one sentence?
Energy intensity measures how much energy is required per unit of economic activity or another defined unit of output.
At economy level, that usually means energy relative to GDP.
Lower intensity generally means we are getting more economic output from each unit of energy.
But remember the warning label:
lower energy intensity does not automatically mean higher technical energy efficiency.
Efficiency matters.
So do economic structure, climate, behavior, activity, electrification and the way we choose to measure output.
The ratio tells you what happened.
Understanding why requires opening the hood.
⚡ “Energy intensity is a dashboard light, not the mechanic.”
Final thoughts
There is something quietly encouraging about energy intensity.
For most of human history, producing more meant using more.
More steel required more coal.
More transportation required more oil.
More buildings required more heat.
More economic activity dragged more energy behind it.
That relationship still exists.
But it is not fixed.
Better machines need less energy.
Buildings lose less heat.
Electric motors waste less.
Economies change what they produce.
Technology changes how they produce it.
And gradually, one unit of energy can support more economic activity than before.
That is what falling energy intensity captures.
Not perfectly.
Not purely.
And certainly not without caveats.
But it tells us something fundamental:
economic growth and energy consumption are not permanently chained together at the ankle.
We can make the chain longer.
Sometimes we can break parts of it entirely.
And in an energy transition where almost everything seems to require building more generation, more grids, more storage and more infrastructure, needing fewer joules for each unit of prosperity is a remarkably useful trick.
Until next time, stay curious! 😎
Discover more from 1000whats
Subscribe to get the latest posts sent to your email.