Energy, explained clearly

Energy is messy. These explainers make it a little less ridiculous — for readers, professionals, and companies alike.

Witty Commercial Operation Date (COD) featured image showing a smiling calendar at a renewable energy project site with construction, solar panels, wind turbines, and financial growth.

What is Commercial Operation Date (COD): The one date that can make—or break—an energy project

Commercial Operation Date (COD) is the moment an energy project stops being a construction story and starts becoming a business. But behind that innocent-looking date sit performance tests, grid approvals, PPAs, lenders, penalties, warranties, and millions of dollars. Here’s what COD really means—and why the entire project team obsesses over it.

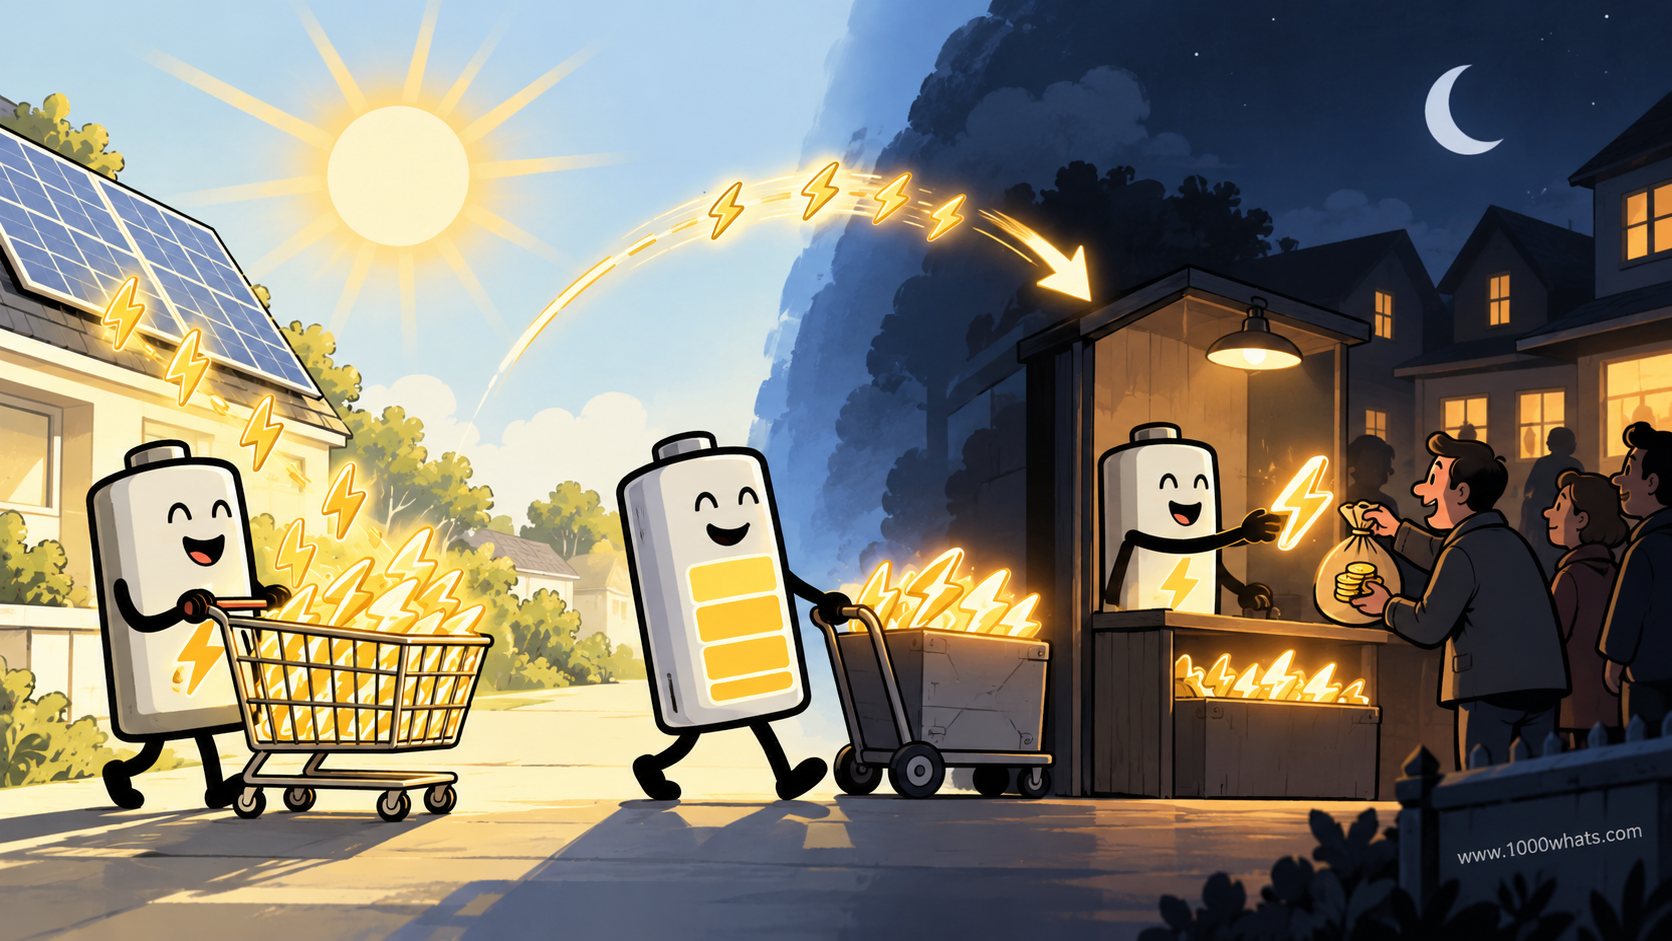
Witty featured image of the duck curve showing a giant duck-shaped figure over solar panels, batteries, homes, and an evening city skyline.

What is the Duck Curve? When solar power collides with peak electricity demand

Solar power can become so abundant in the middle of the day that it creates a completely different problem for the electricity grid: too much power at noon, then a frantic scramble for electricity after sunset. That strange pattern is called the duck curve. Here’s what it is, why it happens, and why batteries, EVs, flexible demand, and smarter grids may finally teach the duck some manners.

Witty windpower featured image showing a cartoon Sun blowing wind into a turbine that generates electricity for a nearby house.

What is wind power? How moving air becomes electricity

Wind power turns the kinetic energy of moving air into electricity—but a turbine doesn’t simply “catch” wind like a sail. From uneven solar heating and atmospheric pressure differences to aerodynamic lift, spinning generators, and grid-ready electricity, here’s what actually happens inside a wind turbine.

Witty capacity market featured image showing a standby generator dressed like a guard outside a lively building, symbolizing payment for being available when the power system needs backup.

What is capacity market? Why power plants get paid even when they’re not generating

Imagine running a power system like hosting the world’s most unpredictable party. Guests arrive early, late, hungry, overheated, and sometimes all at once. That is basically how electricity demand behaves. A capacity market exists to make sure enough power is available when the grid gets stressed. Here’s how it works, why it exists, and why it remains one of the most controversial tools in modern electricity markets.

Witty carbon footprint calculation illustration showing emission sources feeding into a cartoon calculator and resulting in a large smoky footprint being measured.

What is the formula for a carbon footprint? How to actually calculate it without melting your brain

A carbon footprint is usually calculated with one deceptively simple idea: activity data × emission factor. In plain English, that means you measure what you did—like using electricity, driving miles, or burning fuel—and multiply it by the amount of greenhouse gas linked to each unit of that activity. Add everything together, convert it into CO₂e, and you’ve got your footprint.

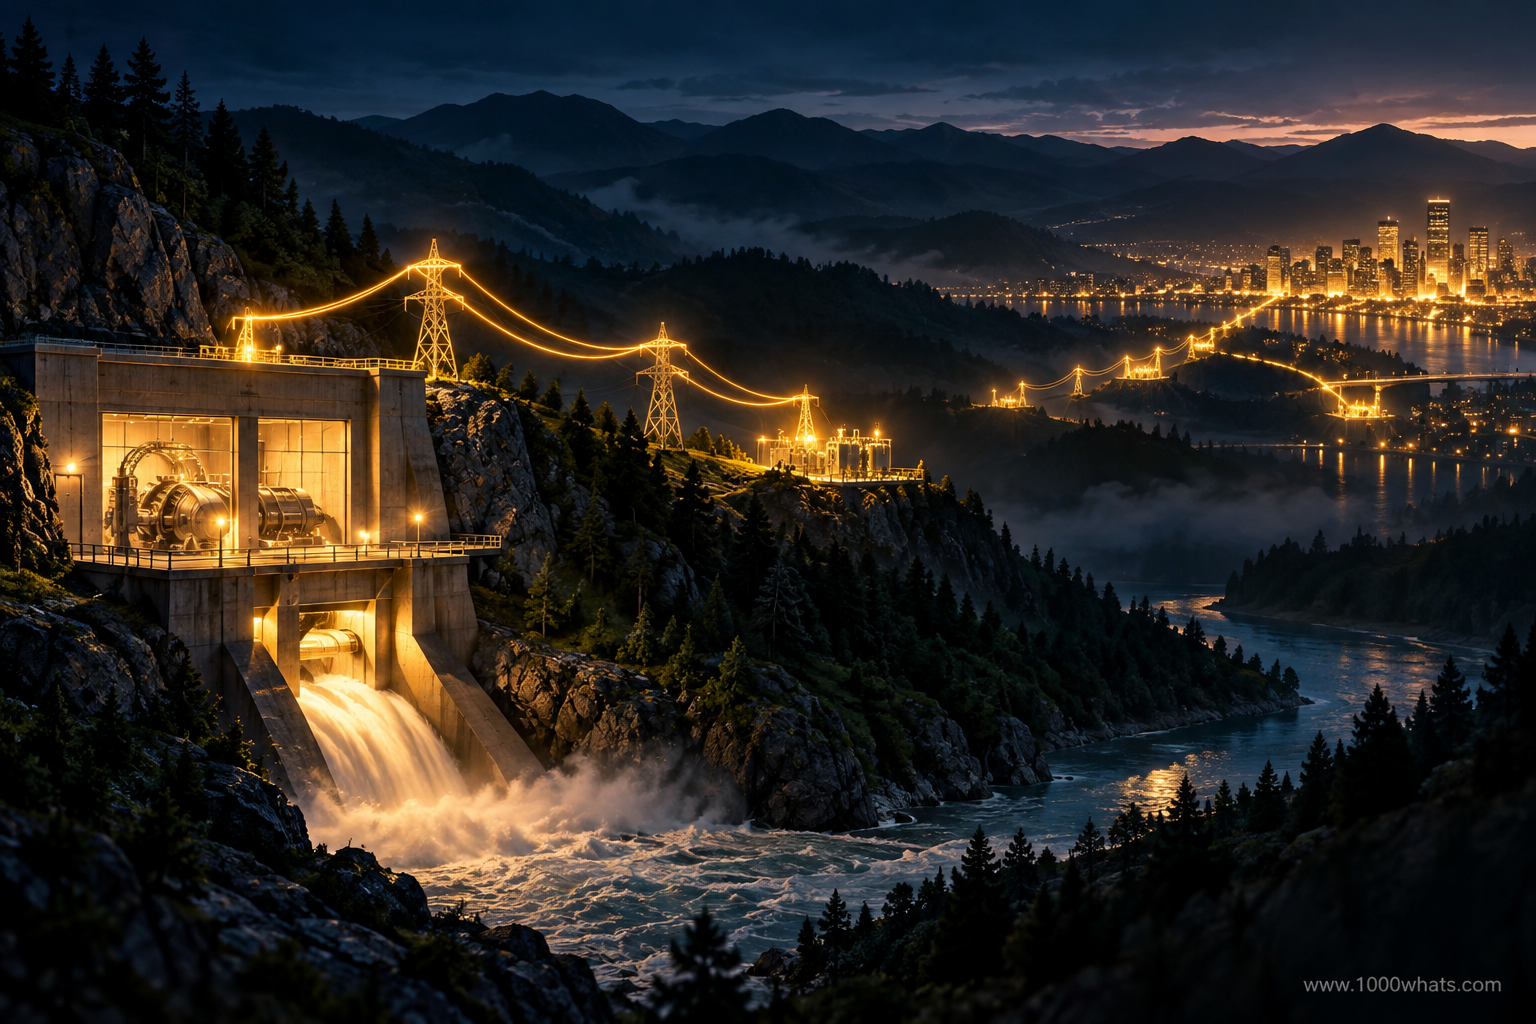
Witty hydropower illustration with a cartoon water character spinning a turbine and sending electricity through power lines to a town.

What is hydropower?

Hydropower is what happens when a river stops being “just water” and starts doing electrical engineering. It takes the motion of flowing water, turns it into spinning machinery, and then turns that motion into electricity through electromagnetic induction. Old idea. Massive impact.