
Imagine this: you own a sleek, fire-breathing sports car, the kind that can zoom up to 200 km/h without breaking a sweat. You know, the type that could rip the toupee right off the guy in the next lane just by revving the engine. Sounds impressive, right? You could be tearing up highways, wind whipping through your hair, turning every speed limit sign into a suggestion rather than a rule.
But instead, here you are, cruising along at a mild-mannered 50 km/h. Like you’re out for a relaxed Sunday drive… every single day. Why? Speed limits, of course. And sure, those rules are there for a reason—keeps everyone safe and sound. Yet, somewhere in the back of your mind, you might start wondering, Was it a mistake to splurge on this roadster if I can’t push it to the limit? It’s like hiring a Michelin-star chef only to have him microwave frozen pizza for you. Sure, the car can go fast, but is it living up to its potential? Not exactly.
Now, let’s shift gears (yep, pun totally intended) and think about power plants. They’re engineered to churn out electricity at full blast, designed to hit that peak output like a car hitting the redline. But most of the time, they’re not going full throttle either. They’re often just humming along, not exactly flexing those high-powered muscles. So, how do we figure out if they’re using all that power potential, or if they’re just coasting in the slow lane?
Enter the concept of capacity factor. It’s the yardstick for measuring whether that power plant is the turbocharged dynamo it was built to be or if it’s just cruising in the slow lane, dreaming of what could have been. Let’s dive into this idea and see how it all shakes out!
What is a capacity factor?
Imagine a power plant, say, a wind turbine, a solar panel, or even a nuclear reactor. Each of these has a maximum amount of power it could generate if everything were perfect—like a car’s speedometer hitting 150 mph on an empty highway with no cops around. But in reality, power plants never run at full blast all the time. They slow down, take breaks for maintenance, or maybe the wind just isn’t blowing that day.
The capacity factor is a measure of how close a power plant gets to that full-throttle potential over a period of time. It’s defined as:
Think of it as a percentage. How much juice did we squeeze out compared to the ideal amount? For example, if a wind farm has a capacity factor of 40%, it means it’s generating 40% of what it could have if the wind blew non-stop at just the right speed.
Capacity factor is a measure of how much electricity a power plant or a generating unit actually produces over a given period of time, compared to how much it could produce if it operated at full power all the time. It is expressed as a percentage, and it can range from 0% to 100%.
Why is it important?
It’s a crucial metric because it tells us how efficiently a plant is being used. A solar farm might have a lower capacity factor than a coal plant because, well, the sun takes a nap every night. But that doesn’t make it worse—it just reflects the different nature of the energy source.
So, next time someone throws the term “capacity factor” at you, just picture it as a measure of how well a power plant is playing the cards it’s been dealt. It’s not about having the best hand, but how well you play it!
How is capacity factor calculated?
Think of it as a way to measure how much of its potential a plant is actually using. A 100% capacity factor means the plant runs at full power all day, every day. It’s like a car engine revving at maximum speed without ever taking a break. On the other hand, a 0% capacity factor means the plant is idle, not generating any electricity.
Here’s the formula in a nutshell:
\[ \text{Capacity Factor} = \frac{\text{Actual Energy Output}}{\text{Maximum Possible Energy Output}} \times 100\% \]A quick example:
Imagine a solar power plant that can produce up to 100 megawatts (MW). If, over an hour, it generates 50 megawatt-hours (MWh), its capacity factor for that hour would be:
\[ \text{Capacity Factor} = \frac{50 \, \text{MWh}}{100 \, \text{MW} \times 1 \, \text{hour}} = 50\% \]This tells us that during that hour, the solar plant operated at half its potential. It’s like it went for a jog instead of a sprint.
How to calculate maximum possible energy output
Let’s say you own a power plant. Maybe 1500 kilowatts (150 MW) of muscle. You want to know, “What’s the absolute most energy this beast can pump out in a year?”
Easy. You multiply its rated power by the number of hours in a year.
Now, the Earth spins steadily—24 hours a day, 365 days a year. That’s 8,760 hours total. So the math looks like this:
1500 kW × 8760 hours = 13,140,000 kilowatt-hours (kWh)
That’s your theoretical max.
Capacity factor over longer periods
But, capacity isn’t always a one-hour story. Over a year, the picture changes. Weather, seasons, and electricity demand all play their part. To find the annual capacity factor, sum all the electricity generated during each hour of the year. Then divide that by what the plant could have produced if it ran at full power the entire time.
For instance, if our solar plant produces 150,000 MWh in a year, and the maximum it could have produced is 876,000 MWh (that’s 100 MW x 24 hours x 365 days), then:
\[ \text{Capacity Factor} = \frac{150,000 \, \text{MWh}}{876,000 \, \text{MWh}} = 17.1\% \]So, over the year, the solar plant is using about 17.1% of its total capacity. Pretty typical for solar, given those cloudy days and nights.
Capacity factor vs. nameplate capacity:
Don’t confuse this with nameplate capacity. Nameplate capacity is like the peak speed of a car. It’s the maximum power a plant can produce under perfect conditions, usually measured in megawatts (MW) or gigawatts (GW). Meanwhile, the capacity factor is a ratio that tells you how much of that peak potential is actually being used over time. It’s a measure of real-world performance, not just the ideal.
Calculate the capacity factor yourself
Now that you understand how capacity factor is calculated, why not try it yourself? Use the tool below to test different scenarios and see how small changes in output can shift the numbers.
Why the capacity factor matters?
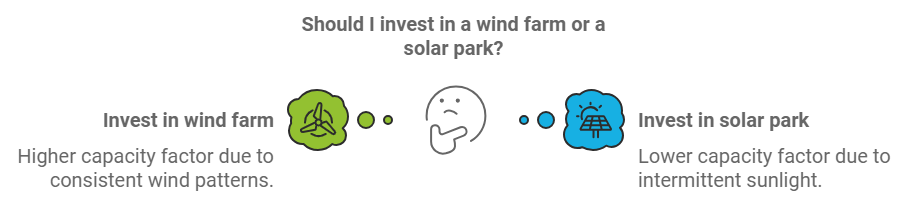
Imagine you’re thinking about investing in a power plant—say, a wind farm or a solar park. One key thing you’d want to know is: How much bang for my buck am I really going to get? This is where the capacity factor comes into play. It’s like a report card for power plants. It tells you how much energy they’re actually producing compared to how much they could produce if they ran at full speed all the time.
Why it matters:
Think of a power plant like a taxi you’re thinking of buying. Sure, it’s nice if the car can potentially drive 24/7. But what if the car actually spends half the day parked? Because there’s no one needing a ride, or there’s traffic jams. You want to know how often that taxi is out on the road, making money for you.
A higher capacity factor means more time generating energy—and, ultimately, more revenue.
Similarly, the capacity factor tells investors how often a power plant is running and producing electricity versus just sitting there, doing nothing. A higher capacity factor means more time generating energy—and, ultimately, more revenue.
Helps with planning profits
A power plant with a high capacity factor makes it easier for investors to estimate how much energy (and therefore how much revenue) it will produce. With low-capacity-factor plants like wind or solar, there’s a bit more uncertainty. It’s like a farmer guessing how big the harvest will be, depending on how good the weather is that year.
Investors don’t like uncertainty because it’s harder to plan how much profit they might make.
Investors don’t like uncertainty because it’s harder to plan how much profit they might make. That’s why understanding the capacity factor helps them decide if a project is worth the investment.
Comparing options
Imagine you’re at a buffet, choosing between dishes. The capacity factor is like knowing which dish you can go back to anytime versus one that’s only available at certain hours. As an investor, you want to make sure you’re putting your money where you’ll get a steady return. Not just when the conditions are perfect.
The capacity factor is like checking how much time your car spends on the road, actually making money, rather than just sitting in the garage.
So, in short, the capacity factor is a critical number for investors. It helps them understand how reliable and profitable a power plant might be. And whether it’s a good use of their money. It’s like checking how much time your car (or taxi) spends on the road, actually making money, rather than just sitting in the garage.
Higher capacity factor isn’t always a guaranteed win
While a high capacity factor often signals more consistent energy production, it doesn’t automatically guarantee stable profits. Several factors can complicate the picture, especially when it comes to different types of power plants.
- Let’s say you’re comparing two options: a wind farm and a natural gas power plant. The natural gas plant might have a capacity factor of around 60-70%. This means it’s capable of generating power most of the time. However, its profitability isn’t just about how often it can run. It’s also tied to the price and availability of natural gas. If fuel prices spike or there’s a supply shortage, the cost of running the plant can increase, eating into the profits. It’s like owning a taxi that’s always on the road, but sometimes the fuel is much more expensive.
- On the other hand, the wind farm might have a lower capacity factor—around 30-40%. It is because the wind isn’t blowing all the time. That’s like your taxi only working 3-4 hours a day and parked the rest. However, once the wind farm is up and running, there are no fuel costs to worry about. The “fuel” is just the wind, which is free. This can mean more stable operating costs, even if the overall energy production is less consistent.
A power plant with a high capacity factor makes it easier to predict energy production, but factors like fuel costs can still impact overall returns.
So, if you invest in a natural gas plant, you might get steadier energy production. But your returns can be affected by fluctuations in fuel prices. Meanwhile, a wind farm may produce less consistently. However, it isn’t tied to volatile fuel markets. This makes operating costs more predictable over time.
What influences capacity factor across different energy sources?
The capacity factor of an energy source depends on a range of factors. Each one influences how consistently a power plant can operate at or near its full capacity. Let’s break down the key factors affecting the capacity factor across different types of energy sources. These range from the unpredictable whims of nature to the hard realities of maintenance and economics:
Resource availability (Wind, Solar, Hydro)
Solar: The sun isn’t always shining. Factors like cloud cover, time of day, and seasons can lead to a lot of downtime. A sunny summer afternoon? High output. But at night or during a cloudy winter day, solar generation plummets to zero. Hence, solar plants tend to have lower capacity factors, often around 15-25%.
Wind: The story’s similar for wind. Wind speeds vary throughout the day and across seasons. If a wind farm is in a location with strong and steady winds, its capacity factor increases. It can reach up to 30-50%. But a lull in the wind means less power generation.
Hydropower: The flow of water determines how much energy a hydro plant can produce. During spring snowmelt or a rainy season, hydro plants can produce at high levels, sometimes achieving capacity factors above 50-60%. But during dry periods, production may slow, bringing the capacity factor down.

Plant type and design (Nuclear, Thermal, Renewables)
Nuclear: Designed to run continuously, nuclear power plants often have very high capacity factors, typically 90% or higher. Their efficiency comes from their ability to run for months without interruption. They only shut down for maintenance or refueling.
Coal and natural gas: These can be adjusted to match electricity demand, which makes them versatile but can also mean they run below full capacity when demand is lower. They might have capacity factors between 40-70%, depending on how often they’re ramped up or down.
Maintenance and downtime (All energy sources)
Planned maintenance: All power plants need downtime for scheduled maintenance—cleaning, refueling, inspections, or repairs. This downtime reduces their capacity factor temporarily.
Unplanned outages: Equipment failures or unexpected repairs can further lower the capacity factor. For example, a wind turbine needing repairs can lead to unplanned downtime. A cooling system in a thermal plant breaking down can also cause unexpected downtime.
Grid demand and market dynamics (Thermal, Renewables)
Electricity demand: Power plants operate in response to demand from the grid. For example, natural gas plants often serve as “peakers.” They ramp up quickly to meet demand spikes but remain idle during off-peak times. This reduces their overall capacity factor.
Renewable energy policies: Incentives, subsidies, or requirements for renewable energy can prioritize renewable sources on the grid. This influences their operational patterns. More renewables on the grid can also cause fossil fuel plants to run less often. This impacts their capacity factor.
Geographical location (Wind, Solar, Hydro)
Where a plant is situated plays a massive role. A solar farm in Chile’s Atacama Desert will have a higher capacity factor due to consistent sunlight. In contrast, a solar farm in Scotland’s misty mountains receives less consistent sunlight, resulting in a lower capacity factor. Wind farms along Ireland’s coast or in Inner Mongolia’s windy plains will also have higher capacity factors. Those in less windy locations will perform with lower capacity factors.
Fuel availability and costs (Coal, Natural Gas, Biomass)
For fossil fuel plants like coal, natural gas, or biomass, fuel availability and price can be limiting factors. If fuel becomes scarce or expensive, it may not be economical to run the plant fully. This can lead to a lower capacity factor. For example, a natural gas plant in Nigeria could face local fuel supply issues. Meanwhile, a plant in Qatar might run more steadily.
Storage and grid integration (Renewables)
Technologies like batteries or pumped-storage hydro help smooth out the variability in renewables. They allow wind or solar to store excess energy and feed it back into the grid when demand is high. Better storage and grid integration can increase the effective capacity factor of these sources. This is true even if their raw generation remains intermittent.
Wrapping it up
Capacity factors vary widely between energy sources, shaped by the predictability of the resource (like wind or sunshine), the design and operation of the plant, and external factors like maintenance needs and market conditions. In short, it’s a tug-of-war between what nature provides, what the machinery can handle, and what the grid needs. Understanding these factors helps us see why some power plants run like clockwork while others are more like “when the wind blows” kind of operations.
What are the usual capacity factors for various types of energy generation?
The capacity factors of different energy sources can vary significantly depending on technology, location, and resource availability. Here’s a rundown of typical capacity factors for various types of energy generation, offering a sense of how much of their potential each type typically utilizes:
Nuclear: 80-95%
- Why so high? Nuclear plants are designed to run continuously for long periods before refueling. They serve as base-load power, meaning they are often running at or near full capacity unless they are down for maintenance or refueling.
- Example: In France, which relies heavily on nuclear energy, the capacity factor often reaches around 85-90%.
Geothermal: 70-90%
- Why so high? Geothermal plants tap into consistent heat from the Earth’s interior, allowing for nearly continuous operation. The only downtime tends to be for maintenance.
- Example: Geothermal plants in places like Iceland or Kenya often maintain capacity factors above 80% due to stable geothermal resources.
Biomass and Waste-to-Energy: 50-80%
- Why variable? Biomass plants can run consistently if there is a steady supply of organic material like wood chips or agricultural waste. However, variations in fuel availability can lower the capacity factor.
- Example: In countries like Sweden, where biomass is used extensively for heating and power, these plants can reach capacity factors around 70%. In areas with less consistent biomass supply, it might be closer to 50%.
Natural gas: 50-70%
- Why so variable? Combined-cycle plants are quite efficient and can run as base-load power, but they are also used as peaking plants, which means their output is ramped up or down based on electricity demand. This makes their capacity factors more variable.
- Example: In regions like the Middle East, where natural gas is abundant, these plants might run closer to 60% capacity. In Europe, where gas is sometimes used to balance the grid, the factor might be lower.
Coal: 40-60%
- Why lower? Coal plants can run continuously, but they are often adjusted to meet fluctuating demand and face competition from cheaper and cleaner energy sources like natural gas and renewables. Some older coal plants have reduced capacity factors as they are phased out.
- Example: In countries like China and India, coal remains a major energy source, often achieving capacity factors in the 60-70% range.
Hydropower: 30-60%
- Why so varied? Hydropower depends on river flow, which can change with seasonal rainfall, snowmelt, and droughts. Reservoir-based hydropower tends to have more stable output than run-of-river plants.
- Example: Large hydropower plants in Brazil can achieve capacity factors closer to 50-60% due to consistent rainfall patterns in certain regions, whereas smaller run-of-river plants in places like Canada or Norway may have lower capacity factors due to seasonal variations.
Wind: 20-40%
- Why variable? Wind turbines depend on wind availability, which varies by location and time of year. Offshore wind farms tend to have higher capacity factors due to more consistent winds.
- Example: Offshore wind farms in the North Sea, like those in the UK or Denmark, can have capacity factors above 40%, while onshore farms in places like Brazil or South Africa may range from 20-35%.
Solar: 15-25%
- Why so low? Solar PV depends entirely on sunlight, which means no production at night and reduced output during cloudy days or in winter months. Solar output also varies based on latitude and local weather patterns.
- Example: Solar farms in the Atacama Desert in Chile, one of the sunniest places on earth, might reach capacity factors of 20-25%, whereas installations in northern Europe might be closer to 10-15%.
Summary table
| Energy Source | Typical Capacity Factor (%) |
| Nuclear | 80-95% |
| Geothermal | 70-90% |
| Biomass and Waste-to-Energy | 50-80% |
| Natural gas | 50-70% |
| Coal | 40-60% |
| Hydropower | 30-60% |
| Wind | 20-40% |
| Solar | 15-25% |
These values provide a snapshot of how efficiently each type of plant tends to operate in real-world conditions. Renewable sources like wind and solar have more variability due to weather dependency. Technologies like nuclear and geothermal achieve higher capacity factors with steady, controllable power generation.
Guide: Estimating capacity factor for new power projects
Before jumping into any power generation project—whether it’s a solar farm, a wind park, or a hydroelectric plant—getting a handle on the capacity factor is key. Think of the capacity factor as a crystal ball that gives you a peek into how much electricity your plant can produce over time compared to its maximum potential. It’s not just about the equipment or technology you choose; it’s also about understanding how nature, the market, and regulations will play their part.
A higher capacity factor often suggests that a plant is running more consistently and generating more revenue. But accurately estimating that number isn’t as simple as checking a box. It’s more like piecing together a puzzle that combines local weather data, technical specs, and even input from people who know the area well. Get it right, and you’ll have a clearer sense of what your project can deliver and how much you can expect to earn. Get it wrong, and you might find yourself surprised by lower-than-expected production or unexpected costs.
This guide walks you through the key steps to estimating the capacity factor before breaking ground, so you can make more informed decisions and set realistic expectations.
Step 1: Gather resource data
What is resource data? Resource data is information that tells you how much of the “fuel” for your power plant is available at a specific location. It’s the starting point for understanding how consistently and how much power your plant will be able to produce. This data varies greatly depending on the type of energy you’re using. For renewable projects like solar, wind, or hydro, it’s all about studying the natural conditions—sunshine, wind speeds, or water flow. For fossil fuels or nuclear energy, this step focuses on assessing the availability and stability of fuel supplies, like coal, natural gas, or uranium.
Examples for different technologies
For solar projects: Gather data on solar irradiance, which measures how much sunlight hits a specific area. This data helps you estimate how much energy a solar panel system can generate throughout the year. You can find this data from solar maps or local meteorological stations that track sunlight patterns across seasons.
For wind projects: Wind speeds and patterns vary greatly by location. By using anemometers or accessing existing wind databases, you can collect data on average wind speeds, direction, and seasonal variations. The goal is to determine how often and how strong the wind will blow, which directly impacts the capacity factor of a wind farm.
For hydro projects: It’s all about water flow. Analyze river flow data or reservoir levels over multiple years to understand seasonal changes and the impact of dry or wet periods. This will help you predict how much energy a hydro plant can produce during different times of the year.
For coal, natural gas, or nuclear plants: The process involves assessing the availability and stability of fuel supplies rather than natural conditions. For example, a coal plant needs a reliable supply of coal, and a nuclear plant requires consistent access to uranium. Fluctuations in fuel supply or price can significantly impact a plant’s ability to run consistently and thus its capacity factor.
Why this matters: Understanding resource availability helps you set realistic expectations for your power plant’s performance. It’s the first step in estimating how often your plant can run near its full potential, laying the groundwork for more accurate capacity factor predictions.
Step 2: Use simulation models
Gathering resource data is just the first part of the puzzle. That data is only useful if you can translate it into expected electricity output. To do this, simulation models are essential—they turn raw data into a clearer picture of how much energy your project can generate.
- Wind energy simulations: These models use your site’s wind speed data to predict how much electricity different types of wind turbines would produce. For example, taller turbines can access stronger, steadier winds at higher altitudes, leading to more power generation. The model also helps you see how different turbine designs (like rotor diameter and blade length) might affect energy output.
- Solar power simulations: Here, the software takes your solar irradiance data and simulates how different panel orientations and tilts would perform. Adjusting the tilt of solar panels can optimize them to capture more sunlight during peak hours or throughout different seasons, boosting the overall electricity generation. For instance, a steeper tilt might be better in winter to catch the low-angle sun, while a flatter setup may work better in summer.
- Hydropower simulations: For hydropower, models take into account river flow rates and seasonal variations to estimate energy output. These simulations can help determine how different types of turbines or dam designs would perform under various flow conditions, ensuring you choose the setup that maximizes electricity generation year-round.
These simulation tools give a more accurate estimate of the capacity factor by showing how effectively your specific setup can convert the available natural resources into actual electricity.
Step 3: Assess plant design and equipment efficiency
Now that we’ve looked at the factors that can make estimating a capacity factor tricky, let’s dive into how the design of your power plant plays a role. The technology and layout you choose directly impact how much energy you can squeeze out of the available wind, sun, or fuel.
Think of this like buying a car. The model, engine, and even the tires can make a huge difference in how far you can go on a tank of gas. Similarly, the specific equipment you choose for your power plant can affect how much electricity you produce.
- Pick the right equipment: Higher-quality solar panels or wind turbines will convert more of the available energy into electricity. For example, a wind turbine with longer blades can capture more wind, even at lower speeds. In solar, more efficient panels will make the most out of even cloudy days.
- Design for efficiency: The way you set up your equipment matters too. For a solar farm, that means positioning panels to get the most sunlight throughout the day. For wind farms, it’s about spacing the turbines far enough apart so that each one gets clean, undisturbed air.
- Plan for maintenance: Every power plant needs downtime for routine check-ups and fixes, just like a car needs regular oil changes. But some designs require more maintenance than others. A plant that needs to shut down frequently for repairs will have a lower capacity factor than one that runs smoothly for longer stretches. Understanding these needs ahead of time helps set realistic expectations for how often your plant will be running.
Think of it this way: A well-designed plant is like a well-tuned engine—it might cost a bit more up front, but it keeps running reliably and delivers more over the long haul.
Step 4: Analyze grid demand and market dynamics
Understanding your plant’s electricity production is one thing. You also need to know if there’s demand for it.
Think of it like running a bakery—no matter how many cookies you can bake, it only matters if people are there to buy them!
- Study local electricity demand: Find out when people in the area need the most power. If demand is high during the times when your plant is running (like sunny days for solar power or windy afternoons for a wind farm), you’re more likely to operate at a higher capacity factor. But if demand dips when your plant is generating the most, you might have to cut back on production, which would lower your capacity factor.
- Look at the local energy mix: Check out what other energy sources are already feeding the grid. For example, if a region already has a lot of wind farms and you’re planning to add another, the grid might become saturated with wind power during windy times. This can lead to something called “curtailment,” where your plant has to produce less to avoid overloading the grid. That can drag down your capacity factor.
- Understand curtailment and grid access rules: Some places have rules about when a power plant can supply electricity to the grid. If the grid is full or there’s more supply than demand, you might be asked to cut back, even if your plant could be producing more. It’s like having to close your bakery for a few hours even though you have a full tray of cookies ready.
In a nutshell: This step is all about figuring out if there’s a steady demand for the electricity you’ll produce and understanding any local rules that might limit how much you can sell. This can have a big impact on your plant’s overall output and profitability.
Step 5: Tap into local knowledge and historical data
Now that we’ve looked at factors like weather data, plant design, and market dynamics, the next piece of the puzzle is learning from those who have already been through the process. Sometimes, a bit of local knowledge can go a long way in avoiding unexpected surprises.
- Talk to local experts: Reach out to engineers, utility companies, or even local energy agencies who have experience with power projects in the area. These folks have hands-on knowledge and can point out challenges you might miss. This includes seasonal changes in power demand or unexpected maintenance needs due to local conditions (think extreme heat, cold, or even wildlife!).
- Look at similar projects: If there’s a wind farm, solar park, or hydro plant nearby, check out how it’s performing. This is like seeing how your neighbor’s garden grows before you plant your own. If a wind farm down the road is running at a 35% capacity factor, it’s a solid clue that your wind farm could achieve something similar, as long as your site conditions aren’t drastically different.
- Use historical data: Past data from similar projects can help you understand the ups and downs of local power generation. For example, if a nearby hydro plant struggled during a drought year, it’s a good reminder to plan for dry spells if you’re thinking about your own hydro project.
Why this matters: Local insights and real-world data can provide a reality check on your expectations, helping you adjust your plans before committing resources. It’s always better to discover potential issues early on rather than after the project is already underway.

Step 6: Understand regulatory and policy environment
After understanding the natural resources, equipment, and local energy needs, there’s one more crucial piece of the puzzle: the rules and regulations that will shape how your power plant can operate. Policies and regulations can have a big impact on when and how much your plant can produce, which means they directly influence your capacity factor.
Every country or region has its own rules about how power plants can operate and when they can sell electricity to the grid. These policies can be a game-changer for your capacity factor. Here’s what you need to look for:
- Incentives and subsidies: Some places offer financial incentives for renewable energy projects. These could be tax breaks, payments for the electricity you generate, or requirements for the grid to prioritize power from renewable sources. This makes it financially worthwhile to operate even when market prices for electricity are low. These incentives can make sure your plant gets to run more often, boosting your capacity factor.
- Grid access rules: Not all power plants are allowed to pump electricity into the grid whenever they want. Sometimes, the grid operators might require a plant to shut down temporarily if there’s too much electricity already being produced. This is called “curtailment,” and it means your plant might have to take a break, even when the wind is blowing or the sun is shining. Knowing these rules can help you adjust your estimates for how often your plant can run.
- Environmental regulations: Some regulations might limit how and when a plant can operate to protect the local environment. For example, hydro plants might be required to maintain a minimum river flow for fish and wildlife, which can reduce how much electricity they can produce during dry seasons.
Think of it like a restaurant with a great menu—if local laws limit your opening hours, it doesn’t matter how good the food is, you’ll serve fewer customers.
By understanding these regulatory factors, you’ll have a clearer picture of how often your plant will be allowed to run at its full potential, which is a big part of estimating your true capacity factor.
Pro tip: Combine all these data points into a detailed feasibility report. This report will not only help you estimate the capacity factor but also identify potential risks and rewards before investing in the project.
By following this guide, you’ll be able to estimate the capacity factor of your proposed power project with greater accuracy, helping you make more informed decisions and minimize surprises once the project is up and running.
Final thoughts
So, we’ve taken quite the journey through the wild world of capacity factors! Who knew that something as technical-sounding as “capacity factor” could be influenced by everything from sunshine and windy days to government rules and market dynamics? It’s a bit like the secret life of a power plant, isn’t it? There’s always more going on behind the scenes than you’d expect.
At the end of the day, whether you’re looking at a sunny solar farm, a breezy wind park, or a more traditional gas plant, the capacity factor is your best guess at how much that plant is actually going to produce. But it’s not the whole story—it’s more like the plot outline, and you still have to fill in the details with your resource data, maintenance schedules, and a bit of policy magic.
So, if you’re thinking of diving into the world of power generation, remember: keep an eye on that capacity factor, but don’t let it out of your sight. It’s a trusty guide, but just like any good sidekick, it needs the right context to help you make the best decisions. Happy power-producing, and may the wind (or the grid, or the sun) always be at your back!
Thanks for visiting 1000whats! I hope this deep dive into the world of capacity factors has sparked your interest and left you with some new insights. But the learning doesn’t stop here—your thoughts and experiences are just as important in making sense of the ever-changing world of energy.
So, here are a few questions to keep the discussion flowing:
- How does capacity factor affect the levelized cost of electricity (LCOE) of different energy sources?
- How does capacity factor vary across different regions and countries, and what are the reasons for the variations?
- How can capacity factor be improved or optimized for different energy sources? What are the best practices and technologies for doing so?
- Do you think capacity factor is the most important metric when evaluating energy projects? Are there other factors that deserve more attention?
- Have you ever been part of a power generation project?
Drop your answers and ideas in the comments! Let’s share knowledge, experience, and thoughts to make the world a little smarter and better, one discussion at a time.
Until next time, stay curious!
Discover more from 1000whats
Subscribe to get the latest posts sent to your email.


[…] 🔎 Want the full breakdown, tech comparisons, and why it matters for your energy planning? 👉 Read more at my blog post on Capacity Factor […]
[…] Want the full story on Electricity retail?I unpacked it on 1000whats → https://1000whats.com/electricity-retail/ […]