


At 9:00 a.m., the accountant walks into a pizza delivery company’s monthly meeting with excellent news.
“We’ve doubled the fuel efficiency of our vans!”
Applause. Someone orders a cake. The finance director begins planning a tasteful vacation.
Then the sales manager stands up.
“Fantastic. We can afford to deliver twice as far!”
The accountant sits down.
Three months later, the vans are using just as much fuel as before. The company delivers more pizza, customers are delighted, and the finance director is now vacationing in the office.
Did the new engines fail?
No. They worked beautifully.
Did the company fail to save fuel per mile?
Not at all. It cut that figure in half.
So why didn’t total fuel consumption fall?
Because making a service cheaper can encourage people to use more of it. And energy efficiency, the sensible grown-up of energy policy, has just discovered that demand is a terrible person to leave alone with a discount.
Welcome to the rebound effect.
And welcome to 1000whats, where today’s story begins with a fuel-saving victory, a suspiciously busy pizza company, and an economist from 1865 who would very much like to say, “I told you so.”
First, the genuinely good news: efficiency really does work
Before we let the economists ruin the celebration, one important point.
Energy efficiency is not an illusion. A machine that needs less energy to perform the same job is genuinely more efficient. The laws of thermodynamics have not been bribed. The motor is not secretly charging a second electricity meter in the basement.
A refrigerator that keeps food equally cold using fewer kilowatt-hours is an improvement. A building that delivers the same indoor comfort with less heat is an improvement. A car that travels the same distance on less fuel is an improvement.
That’s the basic idea behind energy efficiency: less energy input for the same useful service.
Notice the words same useful service. They are doing more work here than a warehouse forklift on December 23.
Engineers often calculate savings by assuming the service stays unchanged. Replace the old equipment, keep the same output, and measure the difference in energy use.
That’s a perfectly sensible engineering calculation. But the real world contains customers, businesses, habits, budgets, competition, and people who respond to cheaper things by wanting more of them.
Engineering can tell us how much energy the new machine needs per unit of service. Economics asks how many units of that service people will now demand.
Both questions matter. One of them tends to arrive at meetings wearing a hard hat. The other brings a spreadsheet and changes the forecast.
The rebound effect, explained without requiring an economics degree
The energy rebound effect occurs when an improvement in energy efficiency changes behavior or economic activity in ways that offset some of the energy savings that would have occurred if demand for the energy service had stayed the same.
In everyday language: the new technology uses less energy to do something, but because doing that thing is now cheaper or more attractive, we may do it more often.
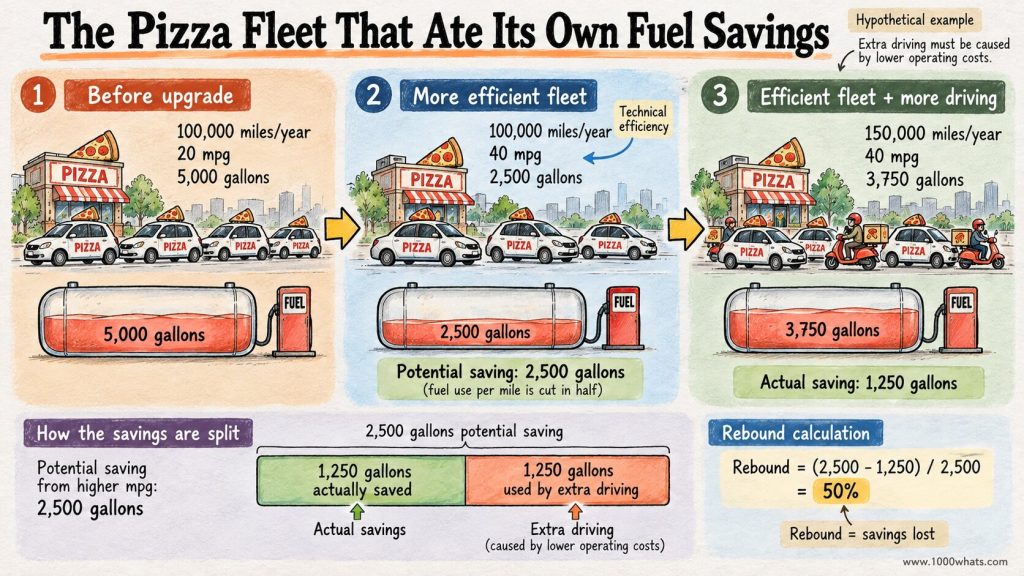
Let’s return to our pizza vans. Suppose the original fleet travels 100,000 miles a year at 20 miles per gallon.
Old fuel consumption = 100,000 miles ÷ 20 mpg = 5,000 gallons.
The company upgrades to vehicles delivering 40 miles per gallon. If the fleet still drives 100,000 miles, it needs only 2,500 gallons.
Expected engineering saving = 5,000 − 2,500 = 2,500 gallons.
Beautiful. The accountant is already browsing beach hotels.
But imagine cheaper deliveries persuade the company to expand its service area. The fleet now drives 150,000 miles.
Actual fuel consumption = 150,000 miles ÷ 40 mpg = 3,750 gallons.
It still saves 1,250 gallons compared with the original year. That’s real. Yet it saves only half the amount the unchanged-mileage calculation predicted.
The other half has been eaten by additional driving. Or, in the language of economists, 50% of the potential saving has rebounded.
Important: this is a deliberately simplified thought experiment. We are assuming the extra mileage was caused by the lower cost of delivering pizza. In a real company, you would have to investigate whether demand grew for other reasons. A new customer is not automatically a rebound effect just because they enjoy pepperoni.
How to calculate rebound: the disappearing-savings trick
For a clearly defined energy service and a consistent baseline, the basic calculation is:
Rebound effect (%) = (Expected savings − Actual savings) ÷ Expected savings × 100
Or, equivalently, compare the extra energy consumed after the efficiency improvement with the engineering savings that would have occurred at unchanged service demand.
In our example, the expected saving is 2,500 gallons and the actual saving is 1,250 gallons:
Rebound = (2,500 − 1,250) ÷ 2,500 × 100 = 50%.
Let’s give the accountant a few alternative endings.
| Annual miles after upgrade | Fuel at 40 mpg | Fuel saved vs. original 5,000 gal | Rebound vs. 2,500-gal potential saving |
|---|---|---|---|
| 100,000 | 2,500 gal | 2,500 gal | 0% |
| 120,000 | 3,000 gal | 2,000 gal | 20% |
| 150,000 | 3,750 gal | 1,250 gal | 50% |
| 200,000 | 5,000 gal | 0 gal | 100% |
| 220,000 | 5,500 gal | −500 gal | 120% |
At 0% rebound, the expected savings survive intact. At 50%, half survive. At 100%, the additional driving has wiped out the entire potential fuel saving.
Above 100%, fuel use rises above its original level despite the more efficient vehicles. Economists call that backfire.
Backfire sounds like something the garage should fix. Unfortunately, this time the engine is innocent.
And don’t miss the denominator. A 50% rebound means half of the expected savings were lost, not that fuel use rose by 50% and not that the vehicle became 50% less efficient. Percentages are very sociable. They will happily attend the wrong calculation unless someone checks their invitations.
Why does efficiency change demand in the first place?
Because efficiency often lowers the cost of an energy service, not just the quantity of energy required to provide it.
For a driver, the service is miles traveled. For a household, it’s hours of comfortable warmth. For a factory, it’s units produced. For a data center, it might be computations completed.
Here’s the essential relationship:
Energy used = Energy per unit of service × Number of service units.
If energy per service unit falls by 50% while service demand doubles, total energy use stays unchanged.
The machine improved. The multiplication did not care.
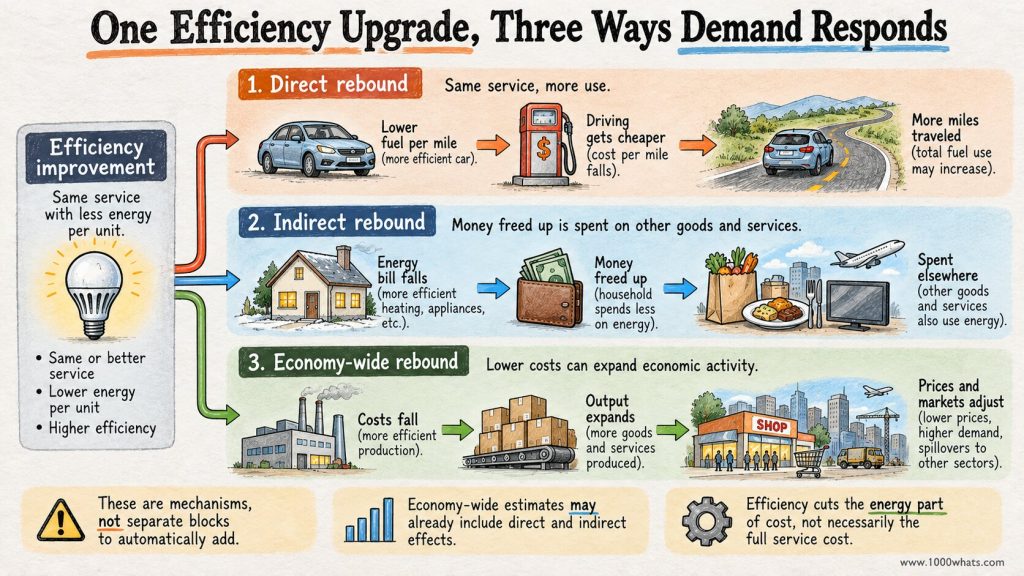
And why would service demand increase? Three broad channels explain most of the story: people use the newly cheaper service more, they spend the savings elsewhere, or the entire economy reorganizes around the cheaper service.
Let’s meet them. They are related, but they do not share a toothbrush.
Direct rebound: “Since it’s cheaper, let’s have more”
Direct rebound happens when people use more of the very service that became more energy-efficient.
Your new car costs less to fuel per mile, so you drive more. Your efficient air conditioner costs less to run, so you cool an additional room. Your LED lights use a fraction of the electricity, so you install decorative lighting on every available surface, including a tree that has never expressed an interest in being illuminated.
The key is that the effective price of the service has fallen.
If gasoline costs $4 per gallon, a car achieving 20 mpg has a fuel cost of 20 cents per mile. At 40 mpg, that falls to 10 cents per mile, assuming the fuel price stays unchanged.
That’s a 50% reduction in fuel cost per mile. Not a guarantee that driving will double, but a reason why some additional trips may become attractive.
Economists describe the sensitivity of demand to price using price elasticity. If demand barely responds when a service becomes cheaper, rebound may be small. If demand responds enthusiastically, rebound can be larger.
And energy isn’t always the dominant cost. Driving still takes time. Cars wear out. Roads become congested. Pizza gets cold. Halving fuel cost does not halve the full cost of a delivery.
That is one reason a cheaper service does not automatically produce a huge rebound. Even the most enthusiastic pizza manager cannot drive 600 miles to deliver a $12 margherita and call it a sound business model.
Indirect rebound: the savings leave the building
Now imagine you insulate your home.
Your heating costs fall by $400 a year. You keep the same indoor temperature, so there’s no direct rebound from heating the house more.
Excellent. You have saved money and energy.
Then you spend the $400 on a weekend trip, a new laptop, or enough online shopping deliveries to establish a personal relationship with the courier.
Those other goods and services also require energy to manufacture, transport, operate, or provide.
This is indirect rebound: efficiency savings free up money that is spent on something else with an energy footprint.
It doesn’t mean spending money is immoral. It means a household’s energy footprint extends beyond the electricity and gas meters attached to its walls.
And indirect rebound isn’t automatically 100%. Spend your heating savings on a museum membership, a bicycle repair, a flight, or paying off debt, and the resulting energy implications can be very different. Even saving money in a bank has indirect economic effects, but attributing those effects requires assumptions about the wider system.
The point is not that every saved dollar secretly turns into a barrel of oil. The point is that financial savings and economy-wide energy savings are not identical accounting entries.
One lives in your bank account. The other has to be traced through an economy full of other people’s bank accounts. Good luck doing that on the back of an electricity bill.
Economy-wide rebound: when the whole market notices the discount
The third channel is larger and harder to measure.
Suppose a factory makes steel using less energy per ton. Its production costs fall. It can lower prices, increase output, win customers, invest in another production line, or force competitors to respond.
Now imagine the same thing happening across transport, buildings, manufacturing, and computing.
Cheaper energy services can alter prices, wages, trade, investment, production patterns, and economic growth. Energy demand may change in sectors that never purchased the original efficient equipment.
That’s the economy-wide rebound effect, sometimes called macroeconomic rebound.
It is also where estimates become especially uncertain. An economy isn’t a laboratory experiment. You cannot put half a country in a control group, improve the other half’s industrial motors, and politely ask everyone not to change jobs, prices, or habits for ten years.
The UK Energy Research Centre’s evidence review emphasizes both the reality of rebound effects and the continued value of energy efficiency. It also explains why the scale of wider effects remains a difficult research question.
So if someone gives you a single universal rebound percentage for all technologies, countries, and decades, ask whether the spreadsheet came with a magic wand.
Enter Mr. Jevons, who saw this argument coming in 1865
Long before delivery apps, smart thermostats, or an internet full of people arguing about electric cars, a British economist named William Stanley Jevons noticed something awkward about coal.
In his 1865 book The Coal Question, Jevons examined Britain’s growing dependence on coal and the improving efficiency of steam engines.
More efficient engines could produce useful mechanical work using less coal per unit of output. That made steam power cheaper and more attractive across mines, factories, transport, and industry.
And if cheaper steam power expanded the number of useful jobs that steam engines could do, total coal consumption might increase rather than decrease.
Imagine inventing a steam engine so good at saving coal that everyone immediately buys another steam engine.
Jevons did not have a marketing department, but he understood the customer acquisition strategy.
The idea became known as the Jevons paradox: under some conditions, better efficiency can be associated with greater total consumption of the resource.
But a historical warning is not a universal physical law. Nineteenth-century coal demand was influenced by industrialization, population, new applications, prices, and many other changes. You cannot isolate efficiency’s contribution merely by pointing to a rising coal chart and saying, “Aha!”
Jevons identified a powerful mechanism. Modern analysis still has to establish how much of an observed increase is actually caused by that mechanism.
Rebound is not the same as Jevons paradox
This distinction deserves its own section because the internet often throws both terms into one large bucket labeled “Efficiency Is Pointless.”
It isn’t.
Rebound means that some expected energy savings are offset by responses to improved efficiency. A 10%, 20%, or 50% rebound still leaves net savings in our simplified example.
Full rebound means 100% of the expected saving is offset.
Backfire, or a Jevons-type outcome, means more than 100% is offset, so total resource use exceeds the relevant no-improvement baseline.
Here’s the quick reference.
| Outcome | Rebound rate | What happens to the potential saving? | What it does not mean |
|---|---|---|---|
| No rebound | 0% | All of it remains | People never change behavior |
| Partial rebound | Between 0% and 100% | Some of it remains | Efficiency has failed |
| Full rebound | 100% | None remains | The equipment stopped being efficient |
| Backfire | Above 100% | Total use rises relative to the baseline | This must happen whenever efficiency improves |
There can also be negative rebound, sometimes called super-conservation, when actual savings exceed the unchanged-service engineering estimate. Behavior changes, but in the opposite direction.
And please note that the baseline in serious research is often a modeled no-efficiency-improvement counterfactual, not simply last year’s energy bill. The distinction becomes crucial when the economy is changing for unrelated reasons.
Let’s talk about the LED that started a nightclub
Few inventions demonstrate the strange relationship between efficiency and demand as elegantly as the LED.
Replace an old incandescent lamp with an LED that delivers comparable light using far less electricity, and the engineering saving is substantial.
But lower operating costs also make it easier to illuminate buildings, bridges, gardens, storefronts, roads, and that tree we mentioned earlier.
Lighting becomes cheaper, so society may demand more of it.
Does that mean LEDs are bad? Of course not. A room that once needed 600 watts for its lighting might now achieve a similar result with a fraction of that input. That remains a technological triumph.
But if the owner uses the savings to light three more rooms, the total bill may fall by less than the simple bulb-replacement calculation suggested.
The LED did its job. The owner expanded the guest list.
This is also why counting the number of lamps is a poor substitute for measuring light delivered, operating hours, and total electricity consumed. More fixtures do not automatically mean more energy; fewer fixtures do not guarantee savings.
Engineers can measure lumens per watt. Economists still need to ask how many lumens people want.
Now for the uncomfortable question: what if rebound is a good thing?
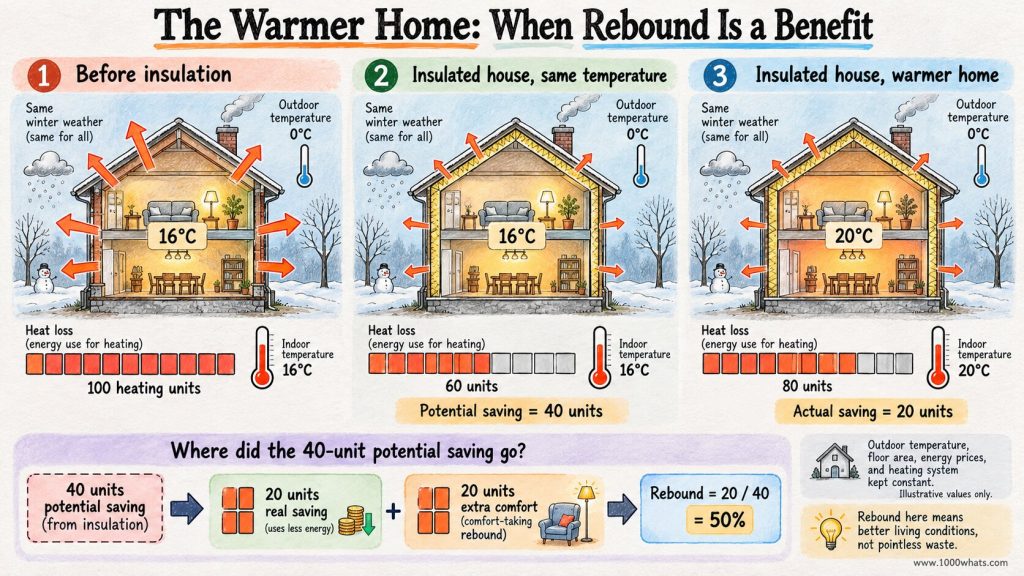
Picture a family that has been keeping its home at 16°C (61°F) in winter because heating is too expensive.
They improve the insulation. The same heating budget can now maintain 20°C (68°F).
The family enjoys a warmer, healthier, more comfortable home. But because they use part of the efficiency gain to increase indoor temperature, the measured energy saving is smaller than an engineer’s constant-temperature estimate.
That is a form of direct rebound, often called comfort taking.
Should we be disappointed?
Only if our energy policy has quietly developed the personality of a medieval dungeon keeper.
In households experiencing energy poverty, some rebound represents a genuine improvement in well-being, not frivolous waste. The International Energy Agency explicitly recognizes that additional heating and cooling can be desirable where people previously lacked adequate comfort.
That does not erase the emissions implications. It changes how we judge the outcome.
Sometimes the correct goal is not simply “minimize kilowatt-hours.” It is deliver decent living conditions with the least practical energy and environmental cost.
The thermometer should not be allowed to win an argument against human beings just because it has more decimal places.
Industrial rebound: the factory that became too successful
Consider a factory producing 10,000 units of a product annually using 100 kWh per unit.
Total annual electricity use is 1,000,000 kWh.
Now a process upgrade cuts consumption to 70 kWh per unit. At unchanged production, electricity use would fall to 700,000 kWh. Potential saving: 300,000 kWh.
But the factory becomes more competitive, wins new orders, and raises production to 12,000 units.
Electricity use becomes 840,000 kWh.
That’s still a saving of 160,000 kWh compared with the original production year. But it’s only 53.3% of the potential 300,000-kWh saving, implying approximately 46.7% rebound if the additional output was induced by the efficiency improvement.
Here’s the trap: output could have increased because of a new customer contract, a competitor closing, or a product launch. Those changes aren’t necessarily rebound. Without a credible counterfactual, the calculation is an illustration, not proof.
And now the business question: was producing 2,000 additional units a failure?
Not for the factory, its customers, or probably its employees.
The company improved energy productivity. It also expanded output. These are two different achievements, and neither should be forced to impersonate the other.
It’s the same reason falling energy intensity does not guarantee falling total energy use. You can become more efficient per unit of economic activity while producing many more units.
A more efficient bakery that sells twice as much bread has not forgotten how to bake. It has simply acquired a very demanding neighborhood.
AI, data centers, and the world’s newest rebound argument
Now take the same idea and give it a server rack.
Suppose an AI system learns to perform a particular computation using one-tenth as much electricity. For the same workload, that’s a remarkable efficiency improvement.
But cheaper computation can enable more queries, new products, longer conversations, automated tasks that were previously uneconomic, and entirely new applications.
In other words, reducing energy per computation can increase the number of computations people want.
The mechanism resembles our pizza fleet. Instead of delivering twice as many pizzas, we might generate twenty times as many summaries, images, or recommendations for places to eat pizza.
That makes rebound a legitimate question for data centers. It does not prove that total AI electricity demand must rise whenever chips or algorithms improve.
Demand depends on prices, product usefulness, adoption, hardware, data-center overhead, deployment constraints, and how the workload itself changes. Meanwhile, electricity use per query is not always a stable or comparable measure across models and tasks.
There is also a classic accounting mistake: confusing more computing activity with more electricity use. They can move in different directions.
The right question is not “Did the chips get more efficient?” They may have. The right question is “What happens to total electricity demand after efficiency and demand both change?”
Efficiency hands computing a discount coupon. Whether computing buys one more sandwich or an entire shopping mall remains an empirical question.
How big is rebound in the real world?
There is no honest universal answer.
Rebound varies by technology, energy service, income, location, prices, time horizon, market structure, and what researchers include in the boundary of their analysis.
A household’s response to better insulation may differ sharply from an airline’s response to more efficient aircraft. A new refrigerator is not a delivery van. A factory is not a national economy. The spreadsheet must respect these distinctions even if its owner has a very persuasive slide deck.
Researchers have measured direct rebound in transport and residential heating, while indirect and economy-wide effects are generally harder to isolate. Reviews, including the UKERC assessment and a 2024 scholarly review, discuss substantial variation in methods and findings.
One study may measure extra miles driven after a vehicle upgrade. Another models spending across an economy. A third compares historical energy use with an estimated alternative world.
Those are not interchangeable measurements. Putting them in one table without explaining the boundaries is like comparing a refrigerator’s electricity use with a supermarket’s annual turnover because both have numbers.
The German Environment Agency also highlights how efficiency-driven price changes can increase use and partly offset savings.
What we can say with confidence is simpler: rebound is real, its magnitude matters, and it should be measured rather than assumed to be zero or 100%.
The baseline problem: measuring the savings that didn’t happen
Suppose a city installs efficient streetlights. Two years later, electricity consumption is unchanged.
Did rebound eliminate the savings?
Maybe. Or the city added new streets. Or the old lights were failing. Or the operating schedule changed. Or somebody installed festive decorations that apparently must remain visible from space.
Before-and-after comparisons are useful, but they cannot by themselves identify rebound.
To estimate it credibly, you need to separate at least three things:
- The technical improvement: how much less energy is needed per unit of service?
- The demand response caused by that improvement: how much additional service use occurs because its effective price or convenience changed?
- Everything else: weather, population, economic growth, changes in production, unrelated prices, and other technologies.
This is why researchers use models, comparison groups, demand elasticities, weather normalization, and carefully chosen counterfactual scenarios.
And it is why the word caused deserves a chair at the meeting.
If electricity demand rises after an efficient appliance arrives, that does not automatically mean the appliance caused the increase. Correlation is a helpful clue. It is not a confession signed in triplicate.
Does rebound mean energy efficiency is pointless?
No. That conclusion takes a useful warning and drives it straight into a ditch.
With partial rebound, efficiency still reduces energy consumption relative to the relevant counterfactual. It may also lower bills, improve comfort, increase productivity, reduce local pollution, and make energy services accessible to people who previously couldn’t afford them.
The IEA’s Energy Efficiency 2024 report emphasizes efficiency’s central role in reducing energy demand and emissions while improving energy affordability.
And the IEA’s analysis of rebound makes a useful distinction: the effect exists, but that does not overturn the evidence that efficiency policies can deliver substantial savings.
What rebound does mean is that the engineering saving is not always the final system saving.
If your new pizza vans save fuel per delivery, that is a genuine technological improvement. If the business expands, the energy system must account for the additional deliveries. Both facts can be true without either one canceling the other as an achievement.
It is entirely possible to celebrate the efficient van and still ask whether the city needs twelve more pizza franchises.
Energy rebound is not the same as emissions rebound
One more complication, because the energy world has never seen a perfectly good distinction it couldn’t turn into three more.
Energy use and greenhouse gas emissions are related, but they are not identical.
Suppose a more efficient electric device uses fewer kilowatt-hours per service, but service demand grows. Total electricity use may fall, stay constant, or rise.
Its emissions effect also depends on how that electricity is generated and when it is consumed.
Similarly, a shift from a gasoline car to an electric vehicle changes both the energy-conversion efficiency and the energy carrier. Comparing gallons with kilowatt-hours without a consistent boundary is not a rebound calculation. It’s a unit conversion waiting for adult supervision.
A useful analysis keeps separate accounts for energy per service, total energy use, total spending, and emissions.
Four columns. Four questions. One accountant who would very much appreciate not having to explain this again.
How do we keep the savings without banning comfortable living?
The answer is not to abandon efficient technology. It’s to combine efficiency with sensible incentives, measurement, and policies that address total demand where necessary.
1. Measure the service, not just the meter
Track electricity per ton produced, fuel per mile, heat per square meter under comparable weather conditions, or energy per computation. Then track total output as well.
If the ratio improves but total consumption rises, you know where to look. You don’t yet know the cause, but at least you’ve found the right door.
2. Keep a credible baseline
For a building, adjust for weather, occupancy, and operating hours. For a factory, account for production changes. For a transport fleet, distinguish extra miles caused by cheaper driving from growth that would have happened anyway.
A baseline is not a historical photograph. It’s an estimate of what would have happened without the efficiency improvement. The difference sounds academic until someone starts writing a savings guarantee.
3. Price the external costs when appropriate
Where additional energy use causes pollution, congestion, or emissions, pricing those impacts can help prevent cheaper energy services from encouraging excessive use. Carbon pricing, congestion charges, or carefully designed energy tariffs can complement efficiency improvements.
That doesn’t mean making basic heating unaffordable. Policy has to account for fairness, essential services, and household incomes. A clever tariff that keeps people cold is not clever.
4. Use standards and system-level targets
Equipment efficiency standards improve the baseline technology. Building performance rules, emissions targets, or other system-level constraints can help ensure total outcomes improve as well.
And demand response can shift some electricity use to better times, although shifting a load is not the same as reducing its annual energy consumption.
5. Celebrate useful service, but count its energy
Some additional consumption is economically and socially valuable. Warm homes, accessible mobility, and productive factories are not policy mistakes.
Still, the extra service has an energy cost. Good analysis does not hide that cost or pretend the benefit doesn’t exist.
The objective is to make the trade-off visible. The spreadsheet should be neither a cheerleader nor a prison warden.
A five-minute rebound checklist for a real project
Before approving a big efficiency project, ask five questions:
- What service is becoming more efficient? Miles, light, heat, tons, or computations?
- How much energy would it save at unchanged service demand? This is the engineering potential.
- Will the lower operating cost change how much service people use? Look at actual incentives, not assumptions about human virtue.
- Could savings be spent or reinvested elsewhere? Define whether you’re measuring one machine, one company, or the wider economy.
- What is the counterfactual? Separate demand caused by efficiency from demand that would have grown anyway.
If you can answer those questions, you are already doing better than a remarkable number of reports that announce a 30% efficiency improvement and then quietly assume the world will stand still out of professional courtesy.
Final thoughts
Energy efficiency is one of the best bargains in the energy system. We get more useful work from the energy we consume. Machines improve. Buildings become more comfortable. Businesses become more productive.
But a bargain changes behavior. Cheaper miles invite more driving. Cheaper heating can make a cold home livable. Cheaper production can expand a factory. Cheaper computation can create uses nobody had imagined.
Sometimes that extra demand eats a little of the expected saving. Sometimes it eats a lot. Occasionally it orders the entire menu and asks for dessert.
The rebound effect is not proof that efficiency is useless. It is a reminder that engineering tells us what a machine can save; economics helps explain what people do with the savings.
So by all means, buy the efficient pizza van. Just don’t promise the accountant a vacation until you’ve asked the sales manager how far the next delivery is going.
Until next time, stay curious! 😎
Discover more from 1000whats
Subscribe to get the latest posts sent to your email.
