
At a highway charging station, a driver spots the magic number: 350 kW. This is excellent news. His car has a 75 kWh battery, so a quick division suggests a full charge in roughly thirteen minutes. He orders a coffee, confident he has time for precisely three sips and a regrettable pastry.
Twenty minutes later, the charger is delivering 62 kW. The coffee is gone. The pastry has won. The driver is staring at the screen as though the car has betrayed a sacred agreement.
The station has not necessarily broken its promise. It advertised what it could deliver. The car never promised to accept it. In fact, the battery has been negotiating the terms of this transaction since the plug clicked into place.
This is the story of the EV charging curve, the wonderfully inconvenient reason a 350 kW sign is not a stopwatch.
Welcome to 1000whats, where we make energy understandable, even when it insists on conducting negotiations in kilowatts.
The charger is a buffet. The battery is a very picky guest.
An EV charging curve shows how the charging power accepted by an electric vehicle changes as its battery fills. Usually the horizontal axis is state of charge (SoC), expressed as a percentage, and the vertical axis is charging power, expressed in kilowatts (kW). Some graphs use elapsed time on the horizontal axis instead.
At a low or moderate SoC, a suitably warm battery may accept a high charging power. As SoC rises, the vehicle often reduces that power. The resulting curve can have a ramp, a plateau, steps, a long downward slope, or some combination. Batteries do not sign an international treaty requiring them all to draw the same shape.
The US Environmental Protection Agency’s charging guide explicitly notes that DC fast-charging power is generally higher when a battery is less full and slows as it approaches full charge. The exact behavior depends on the vehicle and conditions.
The key phrase is power accepted by the vehicle, not power printed on the charger. A 350 kW charger is an establishment with a very ambitious menu. Your car is entitled to order soup.
First, separate the kilowatts from the kilowatt-hours
Before our imaginary driver sends an angry email to the charging station, we need two units. They look suspiciously alike because the energy industry has never met a naming opportunity it couldn’t make slightly worse.
A kilowatt (kW) is power: the rate at which energy is transferred. A kilowatt-hour (kWh) is energy: the quantity transferred over time. If a charger delivers a constant 100 kW for half an hour, the idealized energy delivered is 50 kWh.
Energy (kWh) = average power (kW) × time (hours).
That equation is the useful cousin of the concepts in my guide to power. But it comes with a condition: the power must really be constant, or you must use the average power over the interval.
A peak charging power of 150 kW tells you the fastest instant or short stretch a car may achieve under suitable conditions. It does not tell you that the car will accept 150 kW for thirty minutes. Using the peak for the whole session is like calculating a marathon time from a sprinter’s best five seconds. Your spreadsheet will be delighted. Reality will call security.
And SoC is not a fuel gauge with a perfectly transparent window into every battery cell. The displayed percentage is managed by the vehicle, often over a defined usable battery window. For our calculations we will deliberately assume a simple 75 kWh usable battery and a linear relationship between displayed SoC and usable energy. Real vehicles may differ.
Three participants, one charging cable, and absolutely no trust
When DC fast charging begins, several limits have to agree. The station has its power, voltage, current, thermal, and sometimes shared-site limits. The vehicle has its inlet, battery, wiring, and control-system limits. The battery itself has a temperature, state of charge, cell-voltage constraints, and a history of being asked to do unreasonable things.
The car’s battery-management system (BMS) monitors battery conditions and requests a charging profile. The station and vehicle communicate and regulate delivery within their capabilities and safety limits. The US Department of Energy’s EV charging infrastructure guide explains the distinctions among charging equipment and power levels.
At a simplified instant, the usable power is limited by the smallest applicable constraint. A helpful mental model is:
Actual charging power ≤ station capability, vehicle acceptance limit, and any active cable, voltage, current, thermal, or site limit.
That is an inequality, not a universal control algorithm. The system is dynamic, and auxiliary loads and losses mean power shown at the station need not equal power entering the cells, and metered energy need not equal energy stored in the battery.
Imagine the conversation.
Station: “I can supply 350 kW.”
Car: “My battery would like 110.”
Station: “But the sign is enormous.”
Car: “Congratulations on your sign.”
This is also why two vehicles plugged into identical stations can produce very different charging curves. The charger is offering a service, not issuing an order.
Why the battery slows down before it is full
A lithium-ion battery is not an empty bucket. Charging moves lithium ions through an electrolyte and into electrode materials while electrical current and cell voltage must remain within controlled limits. The exact chemistry and architecture matter, but the general problem is simple: accepting charge rapidly becomes harder to manage as the cells approach their upper permitted state.
Many lithium-ion charging strategies use a constant-current phase followed by a constant-voltage phase. During the latter, current generally declines as the battery approaches its target. At the pack level, EVs may also deliberately step down current earlier to manage temperature, aging, cell imbalance, or other constraints. A real charging curve is not always a neat textbook two-part line.
Pushing too hard can increase heat and accelerate degradation. Under unfavorable conditions, especially with some graphite-based cells at low temperatures, excessively aggressive charging can raise the risk of lithium plating. Battery engineers are understandably reluctant to trade long-term cell health for the privilege of getting you back to your podcast four minutes earlier.
Researchers at Lawrence Berkeley National Laboratory have studied accelerated charging protocols precisely because fast charging must respect the electrochemical behavior of the cells. The objective is not “maximum current, consequences later.” That is a strategy better suited to a cartoon villain.
The familiar advice to stop a highway DC session around 80% comes from this tapering behavior. The EPA’s seven EV tips explain why charging beyond about 80% often consumes disproportionate time. Eighty percent is a practical rule of thumb, not a universal physical cliff. Some cars begin tapering well before it; others maintain useful power above it. Follow the car’s guidance and the range actually needed for the next leg.
A 75 kWh battery enters the restaurant
Time for an actual calculation. Our fictional EV has 75 kWh of usable battery energy. It arrives at 10% SoC with a suitably warm battery, no shared-station restriction, and a charger capable of meeting its demand.
We invent a plausible, deliberately simplified piecewise-constant battery-side charging profile. Each power value below is the average over its SoC segment, not a measured curve from any particular vehicle. Real power changes continuously or in steps, and charging losses and overhead are excluded from these times.
| Battery interval | Energy added to battery | Assumed average battery-side power | Calculated time |
|---|---|---|---|
| 10% to 30% | 15.0 kWh | 150 kW | 6.0 min |
| 30% to 50% | 15.0 kWh | 130 kW | 6.9 min |
| 50% to 70% | 15.0 kWh | 95 kW | 9.5 min |
| 70% to 80% | 7.5 kWh | 60 kW | 7.5 min |
| 80% to 90% | 7.5 kWh | 35 kW | 12.9 min |
| 90% to 100% | 7.5 kWh | 15 kW | 30.0 min |
The arithmetic for the first row is refreshingly free of marketing language:
Energy = 75 kWh × (0.30 − 0.10) = 15 kWh.
Time = 15 kWh ÷ 150 kW = 0.10 hour = 6 minutes.
For the 50% to 70% interval, the same 15 kWh takes 15 ÷ 95 × 60 = 9.47 minutes. We are transferring the same energy, but the battery has become more selective about how quickly it receives it. The waiter has been instructed to stop pouring directly from the pitcher.
Add the first four rows: 10% to 80% takes about 29.9 minutes and adds 52.5 kWh to the battery. The next two rows add only 15 kWh yet take about 42.9 minutes. Our model therefore needs approximately 72.8 minutes from 10% to 100%.
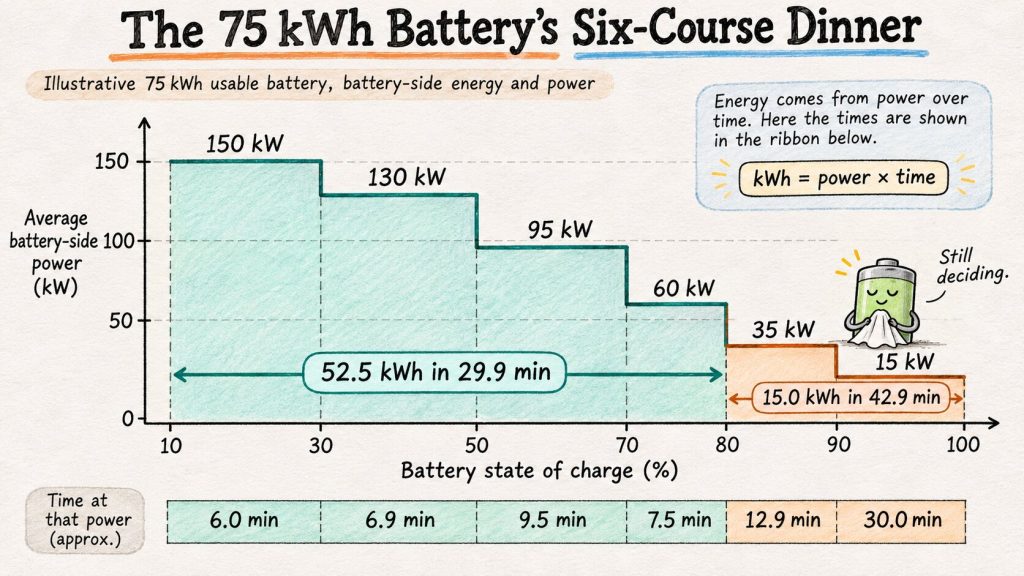
That is the central surprise. The last 20 percentage points contain less than one-third as much energy as the first 70 percentage points, yet take longer. If the battery were a restaurant customer, management would gently ask whether it planned to order anything else this evening.
These are illustrative battery-side times, not a prediction for a real EV. Real charging includes ramp-up, communication, possible thermal conditioning, energy losses, and the time spent finding a functioning connector while three people in the queue conduct amateur cable archaeology.
The peak is a headline. The average pays the bill.
Our fictional car reaches 150 kW in the first segment. But its average power from 10% to 80% is not 150 kW.
Average battery-side power = 52.5 kWh ÷ (29.9 ÷ 60 hours) ≈ 105.4 kW.
Notice what did not work: averaging 150, 130, 95, and 60 to get 108.75 kW. Those powers apply over different lengths of time, so their simple arithmetic mean is not the session average. The correct average is total energy divided by total time. If you average the speeds of a bus without considering how long it spent crawling through traffic, you will produce a timetable that belongs in speculative fiction.
A meaningful EV comparison therefore needs the 10% to 80% time, or better, the energy added and average power over a stated SoC interval under stated conditions. The peak is useful, but it is one scene, not the movie.
Some advertisements quote a 10% to 80% time. Others quote miles of range added in a particular number of minutes. Both can be informative, but they are not interchangeable without knowing usable battery capacity, test conditions, and energy consumption. A car with a larger battery may add more kWh at the same SoC percentage change. A more efficient car may drive farther on those kWh.
Will a 350 kW charger rescue our 150 kW car?
Not in this example. We have given our car a maximum battery-side demand of 150 kW, so a station with a 350 kW nameplate cannot force it to charge faster. A 150 kW-capable station that can actually deliver the required voltage and current is enough to reproduce our assumed curve.
Now compare that with a hypothetical station that caps available battery-side power at 75 kW. For simplicity, we assume no extra losses or current restrictions beyond that cap. Each segment now uses the lower of its original assumed power and 75 kW.
| Battery interval | Time with 150 kW-capable supply | Time with 75 kW cap |
|---|---|---|
| 10% to 30% | 6.0 min | 12.0 min |
| 30% to 50% | 6.9 min | 12.0 min |
| 50% to 70% | 9.5 min | 12.0 min |
| 70% to 80% | 7.5 min | 7.5 min |
| Total 10% to 80% | 29.9 min | 43.5 min |
The 75 kW station costs us about 13.6 additional minutes. Upgrading from that to a genuinely available 150 kW supply helps. Upgrading from 150 to 350 kW does not help this particular assumed car at all.
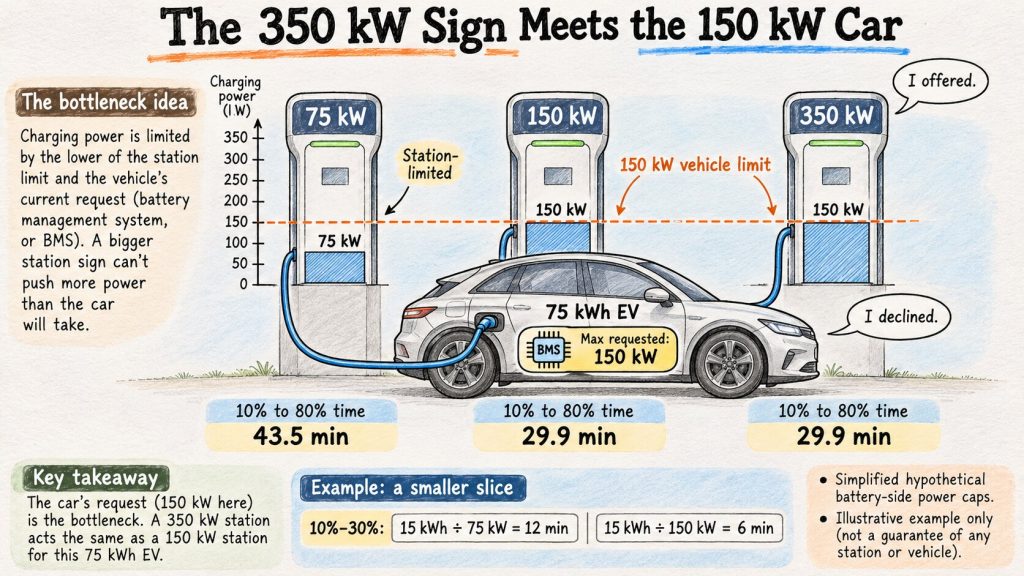
Real charging limits are not always simple power caps. A station’s current and voltage capabilities matter, and its rated maximum may be available only over part of its output range. A shared power cabinet may also divide capacity among multiple stalls. The lesson survives the complications: buying a bigger number on the sign does not necessarily buy a shorter stop.
Two cars race. The slower headline wins.
Let’s give the marketing department a nervous morning. Two fictional EVs have identical 75 kWh usable batteries and arrive at 10% with suitable temperatures. Both use stations that can satisfy their requests.
Car A advertises a glorious 220 kW peak but tapers aggressively. Car B peaks at a comparatively humble 145 kW but holds its power better. The following numbers are invented to illustrate the mathematics, not performance data for real models.
| SoC interval | Car A average power | Car B average power |
|---|---|---|
| 10% to 30% | 220 kW | 145 kW |
| 30% to 50% | 110 kW | 140 kW |
| 50% to 70% | 70 kW | 130 kW |
| 70% to 80% | 40 kW | 100 kW |
| Calculated 10% to 80% time | 36.4 min | 24.1 min |
Car A wins the billboard. Car B wins the parking lot, leaving about 12.3 minutes earlier after adding the same 52.5 kWh.
A peak number is a sprinter. A charging curve is an endurance event. If you shop by peak alone, you may buy the athlete who runs the first hundred yards beautifully and then asks to lie down behind a hedge.
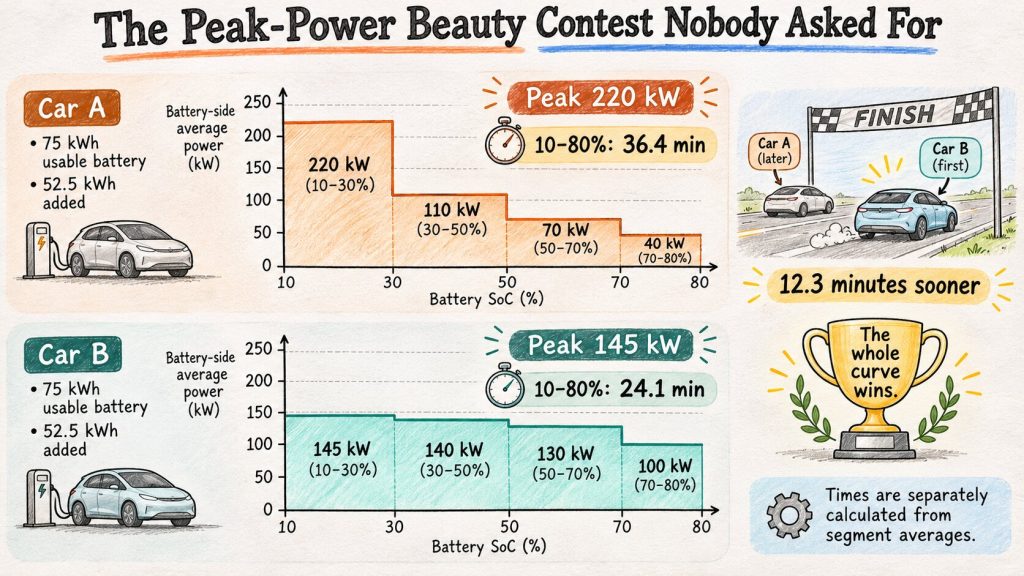
Of course, real vehicles also differ in battery size and driving efficiency. A full comparison of road-trip usefulness needs the range added per minute, not just the percentage added per minute. We will get there.
The cold battery has requested a blanket
At a freezing highway stop, a battery may not accept the same power it would on a mild afternoon. Cold conditions can increase resistance and make aggressive charging less suitable. A very hot battery can also be power-limited. Either way, the car may prioritize safe operating temperatures over the driver’s appointment with a cheeseburger.
Some EVs can precondition their batteries, warming or cooling them before arrival at a fast charger. The US Department of Energy’s winter EV guidance describes preconditioning and why temperature matters. The EPA’s driver tips suggest using the vehicle’s built-in navigation to route to DC fast chargers when that helps trigger battery preparation.
Preconditioning is not free energy. Heating or cooling a battery uses energy, and the benefit depends on the conditions, the vehicle, and the planned charge. For a long highway stop, spending some energy to arrive with a battery ready to accept higher power can save time. For a short errand with plenty of charge remaining, the arithmetic may be different.
This also explains why an online charging curve is a conditional observation, not a hereditary trait. The same car can produce different curves on different days. If your charging session looks worse than a reviewer’s ideal test, investigate temperature, SoC, station output, and whether the car had time to prepare before announcing that the manufacturer has personally insulted your family.
Voltage, current, and the cable’s very reasonable objections
Power is approximately voltage multiplied by current for DC transfer: P = V × I. Using volts and amperes gives watts.
At an illustrative 400 V and 250 A, power is 100 kW. At 800 V and the same 250 A, it is 200 kW. Higher voltage can therefore support more power without increasing current, provided the vehicle, charger, connectors, and other limits permit it.
This is one reason higher-voltage EV architectures can be attractive for fast charging. But an “800 V car” does not automatically charge twice as fast as a “400 V car.” The cells still impose acceptance limits, and a charger must support the relevant voltage and current. Some vehicles have additional hardware to work with lower-voltage stations; others may face restrictions. Real battery voltage also changes with SoC.
The cable is not a passive noodle. Current creates resistive heating, approximately proportional to I²R in a given conductor. Double current with the same resistance and the heating term becomes four times as large. Cables, connectors, cooling systems, and station electronics all have jobs beyond looking reassuringly industrial.
So when the driver asks, “Why won’t this thing give me 350?” the answer might involve cell voltage, current limits, temperature, or a station capability that only exists under particular conditions. The cable has its own union rules.
AC charging and DC charging are different dinner services
At home, most EVs use AC charging. The charging equipment supplies AC electricity, and the vehicle’s onboard charger converts it to DC for the battery. The onboard charger’s rating can limit charging power even if the wall equipment could offer more.
At a DC fast charger, conversion to DC happens mainly in the external equipment, and the station supplies controlled DC power to the vehicle’s battery system. That bypasses the onboard AC charger’s normal power limit, but it does not bypass the battery’s own constraints. The Alternative Fuels Data Center’s home charging guide describes why overnight AC charging is practical for many drivers.
Suppose our 75 kWh usable battery goes from 20% to 80% at home. It needs 45 kWh stored in the battery under our simplified SoC assumption. With an 11 kW AC supply and an assumed 90% wall-to-battery efficiency, the idealized time is:
45 kWh ÷ (11 kW × 0.90) = 4.55 hours.
If the car’s onboard AC charger accepts only 7.4 kW from that supply, the same model gives 45 ÷ (7.4 × 0.90) = 6.76 hours. Neither result includes unusual thermal loads or a late-session reduction in charging power. The 90% is an assumption for this example, not a universal EV efficiency.
Notice the paradox: a six-hour home session may be completely convenient because you were asleep. A forty-minute highway session may feel endless because you are awake, hungry, and standing beside a vending machine that has somehow run out of both coffee and hope.
The 80% rule is really a road-trip arithmetic problem
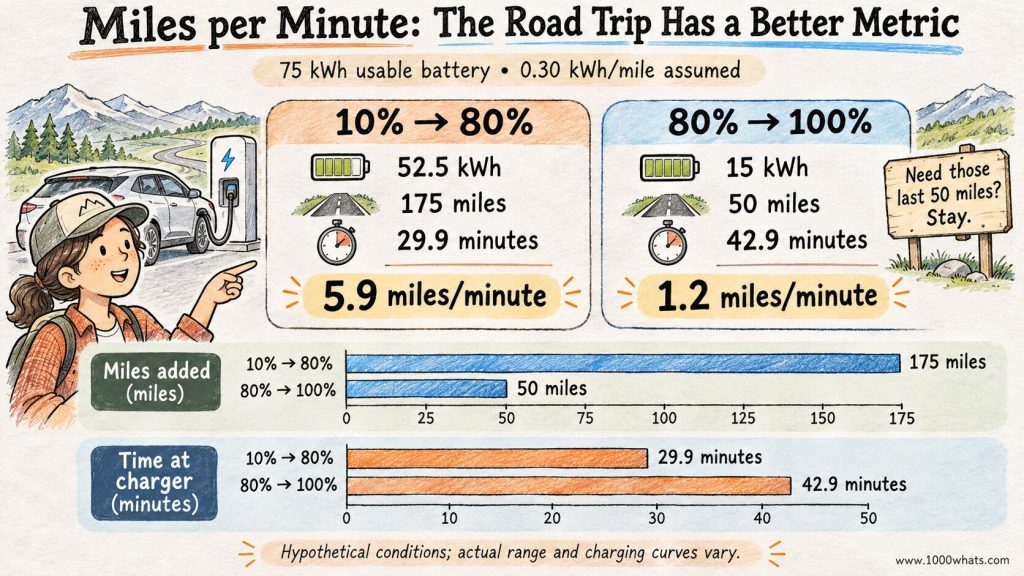
Return to our first fictional car. Assume it consumes 0.30 kWh per mile on the next highway leg. This is a hypothetical driving-energy consumption, not a vehicle rating, and actual consumption depends on speed, weather, terrain, tires, and HVAC use.
Charging from 10% to 80% adds 52.5 kWh, enough for 175 miles at that assumed consumption. It takes about 29.9 minutes, or roughly 5.9 miles of usable driving energy per charging minute.
Charging from 80% to 100% adds 15 kWh, enough for 50 miles, but takes 42.9 minutes. That is only about 1.2 miles per charging minute. The second course costs more time than the main meal and arrives with a tiny fork.
| Charging decision | Energy added to battery | Illustrative driving miles added | Charging time | Miles added per minute |
|---|---|---|---|---|
| 10% to 80% | 52.5 kWh | 175 mi | 29.9 min | 5.9 mi/min |
| 80% to 100% | 15.0 kWh | 50 mi | 42.9 min | 1.2 mi/min |
This does not mean “never charge above 80%.” If the next reliable charger is beyond your range, you need a bigger reserve, or conditions are difficult, staying longer can be sensible. Some drivers also need a higher charge for the next day’s schedule. Battery chemistry and manufacturer guidance matter for everyday charging targets.
The practical question is: How many useful miles will the next ten minutes buy, and do I need them? That is a better road-trip decision than obeying an 80% sticker as if it were carved into a mountain by the battery gods.
For a different perspective on what range anxiety feels like when the dashboard becomes a psychological thriller, see my article on range anxiety.
The receipt is not the battery’s diary
A charging station may bill for energy delivered through its metering system, not the exact increase in chemical energy stored in the battery. Some energy is lost in cables, electronics, battery resistance, and auxiliary systems such as cooling or heating. The size of those losses varies.
For an illustrative cost calculation, suppose 52.5 kWh is stored in the battery and 92% of metered station energy ends up as that stored energy. Then the station must supply 52.5 ÷ 0.92 ≈ 57.1 kWh. At a hypothetical $0.45/kWh, the energy charge is about $25.68, excluding taxes, connection fees, parking charges, or idle fees.
We are not claiming every DC charging session operates at 92% efficiency. It is an explicit modeling assumption. A meter that displays 57.1 kWh and a battery that gained 52.5 kWh are not necessarily in disagreement. They may simply be describing different points in the energy chain.
And be careful with “charging efficiency” as a phrase. It can refer to AC wall-to-battery efficiency, DC station-to-battery efficiency, battery round-trip efficiency, or even how many miles you recover per minute. Same two words, four opportunities to argue on the internet.
The charging curve also decides who waits in line
Now widen the picture. Four fast-charging stalls serve a busy highway stop. One driver has reached 95% and is accepting 15 kW while another driver, waiting in line at 10%, could accept 150 kW. Neither person is doing anything inherently wrong. But the site has limited parking spaces, connectors, and customer patience.
If the first driver only needs to reach the next station, those final percentages may occupy a stall for a long time while adding relatively little energy. Some networks therefore experiment with limits or fees to encourage turnover. For example, Electrify America’s congestion-reduction pilot describes an 85% session limit at selected high-demand sites. That is a site-management policy, not a universal battery rule.
From the grid’s point of view, power demand is also dynamic. A site with four stalls marked 350 kW does not necessarily draw 1.4 MW continuously. Vehicles taper, arrive at different SoCs, and may share a constrained power cabinet. Site-level load management can coordinate charging with the available connection capacity, as the DOE’s smart charge management guidance explains.
This connects EV charging to a larger energy story. We already explored how parked cars might help the grid through vehicle-to-grid technology. Fast charging is the opposite kind of conversation: the grid is serving the car, but the car’s battery still has the final say on the pace.
How to read a charging curve without being fooled
When you compare two EVs, start by asking which SoC interval the graph covers. A 10% to 80% curve is not a 20% to 90% curve. Ask whether the horizontal axis shows SoC or time. Ask whether the power is measured at the station or at the battery. Ask about temperature, preconditioning, station rating, and whether the figures are measured or modeled.
Then check battery capacity. Adding 50 percentage points to a 50 kWh usable pack is 25 kWh in our simple model. Adding the same percentage points to a 100 kWh usable pack is 50 kWh. The percentage display is not an energy unit. It is a fraction of a particular battery’s operating window.
Finally, check the average power and useful range gained over the part of the curve you will actually use. A beautiful 250 kW spike at 8% SoC is of limited value if you usually arrive at 45% and leave at 75%. The battery has written a very impressive résumé, but you are hiring it for a different shift.
If a curve comes from a single test, treat it as a data point rather than an iron law. A robust comparison uses repeatable conditions and multiple sessions where possible. The more precisely a graph states its assumptions, the less likely it is trying to seduce you with a particularly photogenic kilowatt.
A few charging myths deserve their own parking tickets
“A 350 kW charger charges every EV at 350 kW.” No. The station’s maximum is not the vehicle’s acceptance rate, and other constraints can apply.
“My car peaked at 220 kW, so it must charge faster than one that peaks at 150 kW.” Not necessarily. The entire curve determines the time required to add a given amount of energy.
“Charging slows at exactly 80% on every EV.” No. Eighty percent is a useful travel heuristic, not a law of electrochemistry with its own police force.
“A higher SoC percentage always means the same number of kWh in every car.” Absolutely not. Battery size and usable-energy definitions differ.
“A slow charging session proves the station is defective.” Sometimes a station really is limited or malfunctioning. Other times the car is cold, hot, nearly full, or asking for less power. Diagnosis requires more than glaring at a screen.
Final thoughts
Our highway driver finally leaves the charger. The screen still says 350 kW. His battery, now nearly full, has spent the last half hour accepting energy with the enthusiasm of a cat being offered a bath. Nothing mysterious happened. The power changed as the battery’s operating conditions changed.
That changing relationship is the EV charging curve. It tells you why the largest advertised kilowatt number may not deliver the shortest stop, why the last 20% can feel like an entire geological era, and why a warm battery at the right SoC often matters more than a heroic sign above the cable.
For actual trip planning, remember three things: energy added, time required, and miles you can drive with that energy. Peak power can join the conversation once it has learned not to interrupt.
The next time a charger boasts 350 kW, you can appreciate the engineering without expecting your car to swallow the whole buffet. It has a schedule, a chemistry degree, and absolutely no interest in your pastry-related regrets.
Until next time, stay curious! 😎
Discover more from 1000whats
Subscribe to get the latest posts sent to your email.