Let’s say you’re out shopping for a car. You find one that fits your budget, maybe even your dreams. The price looks right. So, you drive it off the lot, smiling like you just outsmarted capitalism.
But then, the story unfolds.
The tires wear out, the brakes squeak like an anxious mouse, and gas prices leap like they’re on a trampoline. You spill coffee. Twice. Ten years pass, and that “good deal” has slowly siphoned cash from your pocket like a magician pulling scarves from a sleeve.
Eventually, you do what all responsible humans do after the damage is done—you tally the costs. Fuel, repairs, insurance, those questionable pine-scented air fresheners. Then you divide by the total kilometers you’ve driven.
That number stares back like a rude awakening. “Wait… I paid how much just to go to the grocery store??”
You think back to that boring green sedan your spouse hated. It was cheaper. Could’ve saved you a bundle per kilometer. But you didn’t have the numbers then.
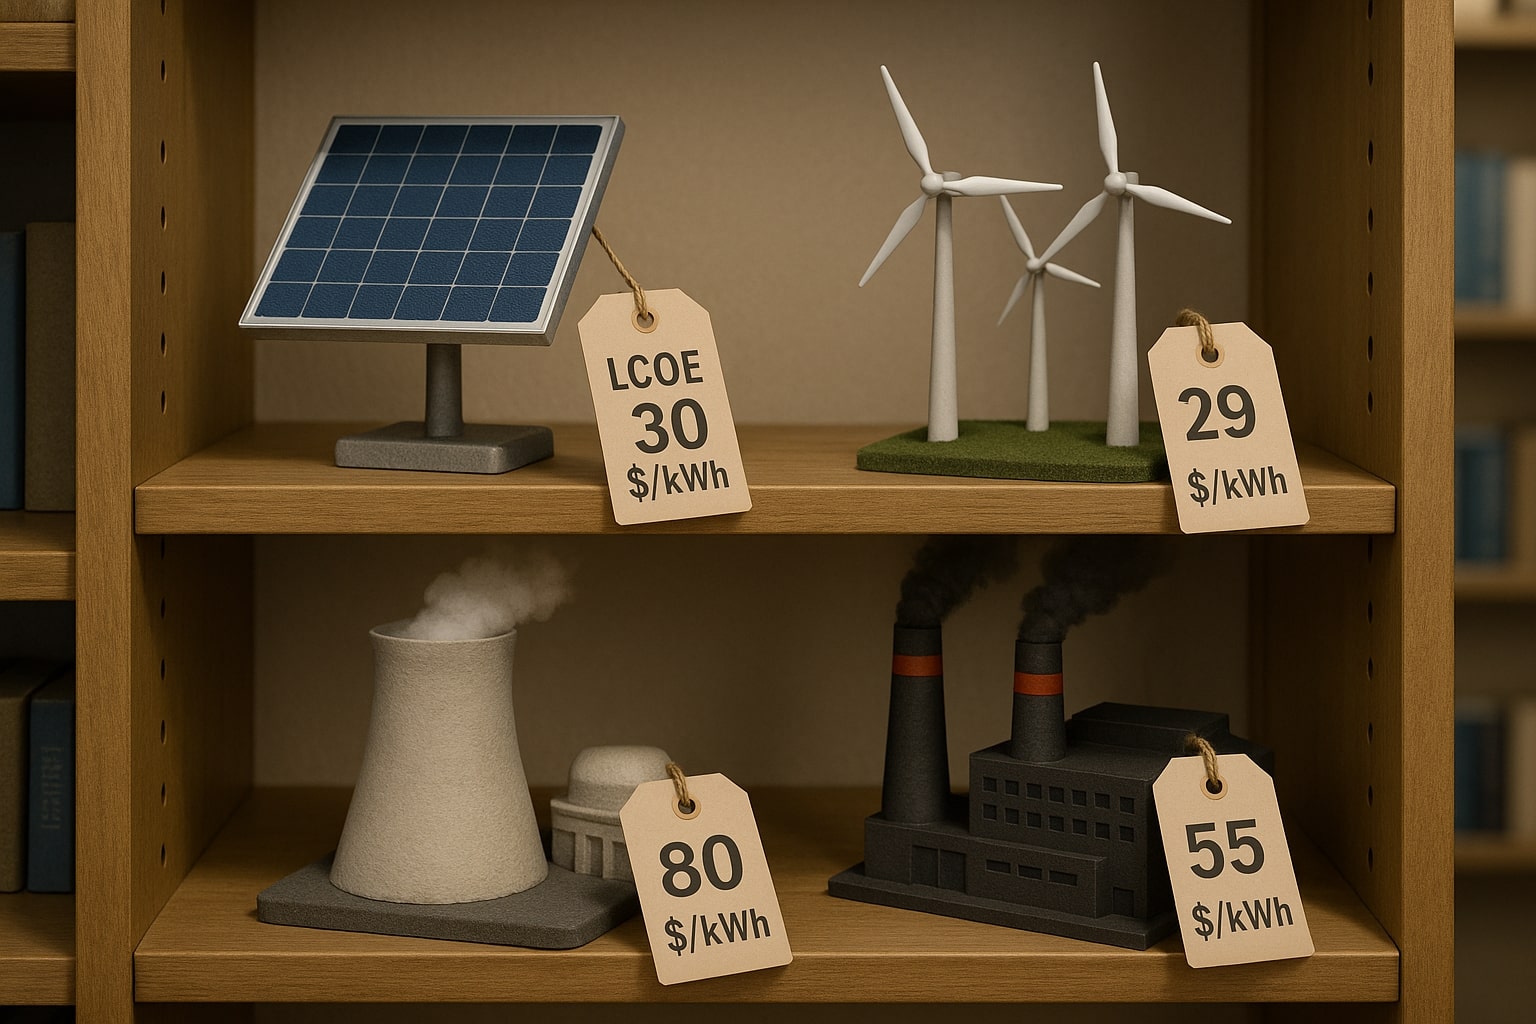
If only cars came with a sticker that said: Lifetime Cost per Kilometer.
Well, in the world of energy—they do.
Welcome to 1000whats: Where energy gets personal. Here, I take big energy ideas and slice them into bite-sized, digestible bits.
In the coming posts, I’ll break down the formulas, explore the hidden assumptions, and show how one humble metric steers trillion-dollar decisions.
So buckle up. The watts and whys are just getting started.
What is LCOE?
LCOE stands for Levelized Cost of Energy. It’s the average cost to produce one kilowatt-hour (kWh) of electricity over a power plant’s entire lifetime.
That means it includes everything: the cost to build it, run it, fuel it, fix it, and eventually shut it down. Just like your car.
So why does this number matter so much?
What if you could compare a wind farm in Texas, a solar park in Arizona, and a nuclear plant in France using a single number? That’s precisely the power of LCOE.
LCOE, or Levelized Cost of Electricity, answers this question:
👉 How much does it really cost to produce one kilowatt-hour (kWh) of electricity from a specific energy source, averaged over the system’s lifetime?
Think of it like the cost-per-km of a car: you don’t just factor in the purchase price—you include fuel, maintenance, repairs, insurance, and depreciation.
With energy, LCOE does the same. It “levelizes” all costs over the lifetime of an energy project and divides that by the total electricity it will generate.
The result? A clean, comparable number—usually measured in cents or dollars per kWh—that allows decision-makers to compare apples to apples.
Apples to apples in energy land
Why does this matter?
Because not all energy sources are created equal. A nuclear plant has enormous upfront costs and lasts 60+ years. A solar farm is cheaper to build but produces less energy at night or on cloudy days.
LCOE balances these variables, providing a common economic yardstick.
In fact, governments, utilities, and investors rely heavily on LCOE to decide what gets built.
According to the U.S. Energy Information Administration (EIA), the LCOE for utility-scale solar is now around $32 per MWh, making it one of the most cost-effective options for new generation—often cheaper than gas or coal.
💡 Real-life example: Solar vs. gas
Let’s say you’re evaluating two projects:
- A gas plant with a low upfront cost but fluctuating fuel prices
- A solar farm with higher initial capital but no fuel costs
The gas plant might look cheaper at first. But when you factor in 25 years of fuel and maintenance? Suddenly, solar starts looking like a bargain.
LCOE captures that story. It tells us, over time, which technology will give us the best bang for our buck.
How is LCOE calculated?
Okay, it’s time to lift the hood and look at how the magic number is made. But don’t worry—we’ll walk you through the math without making your head spin.
Here’s the basic formula for LCOE:
LCOE = Total lifetime costs / Total lifetime electricity produced
Or, more precisely:
LCOE = Σ[(It + Mt + Ft) / (1 + r)^t] / Σ[(Et / (1 + r)^t)]
That might look intimidating, but let’s break it down:
| Symbol | Meaning |
| It | Investment cost in year t (think: construction, equipment) |
| Mt | Operations & maintenance (O&M) cost in year t |
| Ft | Fuel cost in year t (for fossil or nuclear plants) |
| Et | Electricity generated in year t |
| r | Discount rate (adjusts for the time value of money) |
| t | Year of operation |
The formula “discounts” all future costs and outputs to today’s dollars—because $1 today isn’t the same as $1 ten years from now.
Let’s make it tangible
Say you build a solar PV farm:
- It costs $1 million to build (It)
- You spend $10,000 each year maintaining it (Mt)
- No fuel costs (Ft = 0)
- It generates 500,000 kWh per year (Et)
- You use a discount rate of 5% (r = 0.05)
- And it operates for 25 years (t = 1 to 25)
LCOE tells you how much each of those kilowatt-hours really costs when you spread the costs over the project’s life and adjust for inflation and risk.
Your final LCOE might come out to something like $0.045/kWh—which you can compare to the LCOE of other technologies or the average market price of electricity.
💡 Why not try it yourself? Adjust the values below and see how the LCOE changes—it’s a simple way to understand how project costs, generation, and lifetime impact the true cost of electricity.
Why this math matters
Behind every clean energy decision—from rooftop solar panels to billion-dollar nuclear plants—is this humble formula. It informs:
- Which projects get financed
- Which get built
- And which stay on the drawing board
But here’s the kicker: the same numbers can give you wildly different LCOEs depending on your assumptions.
Use a higher discount rate? Nuclear suddenly looks way more expensive. Assume a sunnier location for solar? The LCOE drops dramatically.
That’s why understanding the inputs is just as crucial as the output.
What are the key ingredients that make up LCOE?
If LCOE were a cake, then it’s baked with some very specific ingredients—and the flavor changes depending on what you put in. Let’s open the pantry and explore the critical components that determine whether your energy project comes out sweet… or sour.
1. Capital costs (CapEx)
This is the upfront cost of building the project—the concrete, turbines, solar panels, land, permits, and all the physical stuff. It’s usually measured in dollars per kilowatt ($/kW).
💡 Example: Nuclear plants can cost over $6,000/kW, while utility-scale solar might be around $1,200/kW. That’s a big head start for solar when calculating LCOE.
Think of CapEx like buying a house—it’s expensive at first, but you’re spreading the cost over 30 years of use.
2. Operations & Maintenance (O&M) costs
These are the yearly costs of keeping things running. They come in two flavors:
- Fixed O&M: Insurance, staff wages, scheduled maintenance
- Variable O&M: Costs that depend on how much energy you generate, like wear-and-tear
Renewables usually have lower O&M costs since there are fewer moving parts (no spinning turbines in solar panels!).
3. Fuel costs
For fossil fuel and nuclear plants, fuel is a major variable expense. You have to buy coal, gas, or uranium year after year. In contrast, solar and wind have zero fuel costs—a huge economic advantage over time.
It’s like comparing a gas-guzzler to an electric car. One sips fuel forever, the other just runs on sunlight.
4. Capacity factor
This is the percentage of time your plant is actually producing electricity. A plant that could theoretically produce 1,000 MWh per year but only produces 500 MWh has a 50% capacity factor.
Want the full story on Capacity factor?
I unpacked it on 1000whats → https://1000whats.com/capacity-factor/
5. Degradation rate
Especially for solar panels, performance declines over time. Even a small annual drop (like 0.5%) can reduce the total lifetime output—and increase the LCOE if not accounted for.
6. Discount rate
The discount rate reflects the time value of money and the financial risk of a project. It’s one of the most important variables in calculating LCOE—especially for technologies with high upfront costs and long payback periods, like nuclear or offshore wind.
This is the finance world’s way of saying: “Money in the future is worth less than money today.”
A higher discount rate punishes technologies with high upfront costs and long payback periods (like nuclear or offshore wind).
Governments often tweak this number to make policies more or less favorable to certain technologies—turning LCOE into a quiet but powerful policy tool.
LCOE is like a recipe: small changes in ingredients can create a very different outcome. And just like in baking, precision matters.
By the numbers: EIA’s 2030 LCOE estimates
Let’s get specific. The U.S. Energy Information Administration (EIA) publishes detailed estimates of LCOE for new power generation resources every year, offering a snapshot of how different technologies stack up.
For projects expected to begin service in 2030, here’s what the EIA projects (in 2024 dollars per megawatt-hour):
| 💡 Technology type | 💲 LCOE (2024 $/MWh) |
| Onshore wind | $29.58 |
| Solar PV | $31.86 |
| Combined-cycle gas | $37.58 |
| Hydroelectric | $53.44 |
| PV-battery hybrid | $58.54 |
| Geothermal | $48.78 |
| Combustion turbine | $53.44 |
| Biomass | $80.85 |
| Advanced nuclear | $81.45 |
| Offshore wind | $88.16 |
| Gas w/ Carbon capture (CCS) | $64.55 |
| Battery storage | $126.20 |
👉 Note: These costs include government tax credits and are based on a typical 30-year project lifespan.
What do these numbers tell us?
- Solar and wind are officially the cheapest new-build options. Even hybrid solar-battery systems now compete with traditional gas.
- Nuclear and storage remain capital-intensive, but play a key role in dispatchable, low-carbon grid reliability.
- Fossil fuel technologies with carbon capture (CCS) are still among the most expensive—highlighting the cost challenge of “cleaning up” legacy fuels.
The numbers tell a bigger story: in most cases, renewables aren’t just the cleaner choice—they’re the cheaper one.
LCOE is the scoreboard, and clean energy is racking up points.
How has LCOE helped renewables rise?
Here’s a plot twist you might not expect: the clean energy boom wasn’t just driven by climate goals—it was powered by math.
That’s right.
While the heart of the renewable revolution beats with environmental urgency, its financial fuel came from a sharp drop in LCOE. In fact, LCOE has become the economic proof point that renewables aren’t just cleaner—they’re cheaper.
A decade of declines
Let’s go back a decade.
In 2010, the LCOE for utility-scale solar was around $0.38/kWh. Fast-forward to today, and it’s closer to $0.043/kWh, according to IRENA (International Renewable Energy Agency). That’s an astonishing 89% drop.
Wind energy?
- Onshore wind fell from about $0.09/kWh to $0.034/kWh—a 62% decline.
These drops weren’t small incremental changes—they were seismic shifts that flipped the script on global energy economics.
LCOE as a global investment magnet
Investors started paying attention. And so did policymakers.
Once the LCOE of renewables dipped below fossil fuels, the narrative changed from “Why go green?” to “Why not?”
Countries began using LCOE comparisons to shape auctions, subsidies, and grid planning.
Take India, for example: In 2020, solar projects started winning electricity bids at lower prices than coal. Not because of environmental pressure—but because solar had the lower LCOE.
Even oil-rich nations like Saudi Arabia and the UAE now pursue massive solar builds. Why? The LCOE is just too good to pass up.
New projects vs. old plants
Here’s the twist: while new renewables are often cheaper than building new fossil plants, they’re not always cheaper than existing fossil plants. For example:
- Existing U.S. gas plants have an LCOE around $36/MWh
- New solar projects come in at $32/MWh, and wind at $30/MWh
That’s close. But tearing down working fossil plants still comes at a cost. So LCOE helps highlight where clean energy can compete—but also shows the challenge of replacing entrenched infrastructure.
Not just about price
While LCOE opened the floodgates, the next phase is all about value—grid integration, flexibility, and storage. Still, the steep decline in LCOE gave solar and wind their economic wings—and changed global energy investment forever.
What are the alternatives to LCOE?
Imagine trying to judge a new smartphone only by its price tag—ignoring speed, battery life, or camera quality. You’d miss the full picture, right?
That’s the challenge with LCOE. As useful as it is, LCOE tells us what electricity costs to make, but not what that electricity is worth—especially when we consider when, where, and how it’s delivered. So, energy analysts have cooked up some smarter tools to fill in the gaps.
Let’s meet the LCOE 2.0 squad.
1. LACE — Levelized avoided cost of energy
If LCOE is the cost, then LACE is the value. It estimates how much money the grid saves by adding a new power plant.
For example:
- If a solar plant helps avoid the use of expensive peaker gas plants, it has a high LACE.
- If it adds power when the grid already has too much, it has a low LACE—even if its LCOE is cheap.
The rule of thumb?
👉 If LACE > LCOE, the project adds net value.
👉 If LACE < LCOE, it’s not worth it from a grid economics perspective.
2. VALCOE — Value-adjusted LCOE
Developed by the IEA and OECD Nuclear Energy Agency, VALCOE is like LCOE’s smart cousin with better situational awareness.
It adjusts the LCOE to reflect three big things:
- Time: Does it generate during peak demand?
- Location: Is it close to where power is needed?
- Reliability: Can it ramp up when needed?
A solar farm that produces tons of energy in the middle of nowhere? Cheap LCOE, low VALCOE. A flexible battery system near a dense city? Pricier LCOE, high VALCOE.
In short: VALCOE tells us how useful a generator is—not just how cheap.
3. LCOS — Levelized cost of storage
As renewable energy grows, storage becomes essential. But how do we measure the economics of a battery?
That’s where LCOS comes in. It calculates the total cost per kilowatt-hour of energy stored and discharged over a battery’s life.
What affects LCOS?
- Battery life (cycle count)
- Efficiency (how much energy is lost during charging/discharging)
- Maintenance and replacement costs
- Discharge duration (longer is better for economics)
Batteries don’t generate electricity—they shift it. LCOS helps quantify how much that shifting is really worth.
Why this evolution matters
As our grid gets smarter, more complex, and more dependent on variable renewables, we need metrics that look beyond the busbar. LACE, VALCOE, and LCOS reflect the real-world challenges of keeping the lights on 24/7.
In today’s grid, a kilowatt-hour isn’t just a commodity—it’s a service. And LCOE alone can’t capture that.
Final thoughts
LCOE isn’t just math—it’s a crystal ball for energy planning.
It squeezes decades of costs into one price tag per kilowatt-hour. Simple. Brutal. Honest.
It’s like asking your energy future for a receipt.
Thanks to LCOE, solar and wind went from overpriced dreams to budget-friendly reality. Investors got smart. Coal got ghosted.
Now, every big energy decision starts with one question: What’s the LCOE?
And just like that, this humble metric quietly shaped the future.
Let’s keep the conversation going
Curious to dive deeper? Here are some thought-provoking questions to explore:
- How does LCOE vary across different regions and countries, and why?
- How does LCOE change over time, and what are the factors that drive its evolution?
- How could LCOE be modified to better account for carbon emissions and environmental externalities?
- Could we develop a universal “energy value index” that merges cost, flexibility, and environmental impact into one metric?
If you made it this far, congrats—you now speak fluent LCOE. Sort of. 😁
Thanks for visiting 1000whats, where energy gets personal and numbers wear party hats.
Got questions, ideas, or a spicy energy take of your own? Drop a comment below—I read them all (even the ones written in ALL CAPS).
Your thoughts power this place—just like electrons, but with better spelling.
See you in the next post. Stay curious and stay charged! ⚡
[…] panel prices have dropped nearly 90% since 2010. Offshore wind farms stretch across coastlines, generating clean electricity at mind-blowing […]