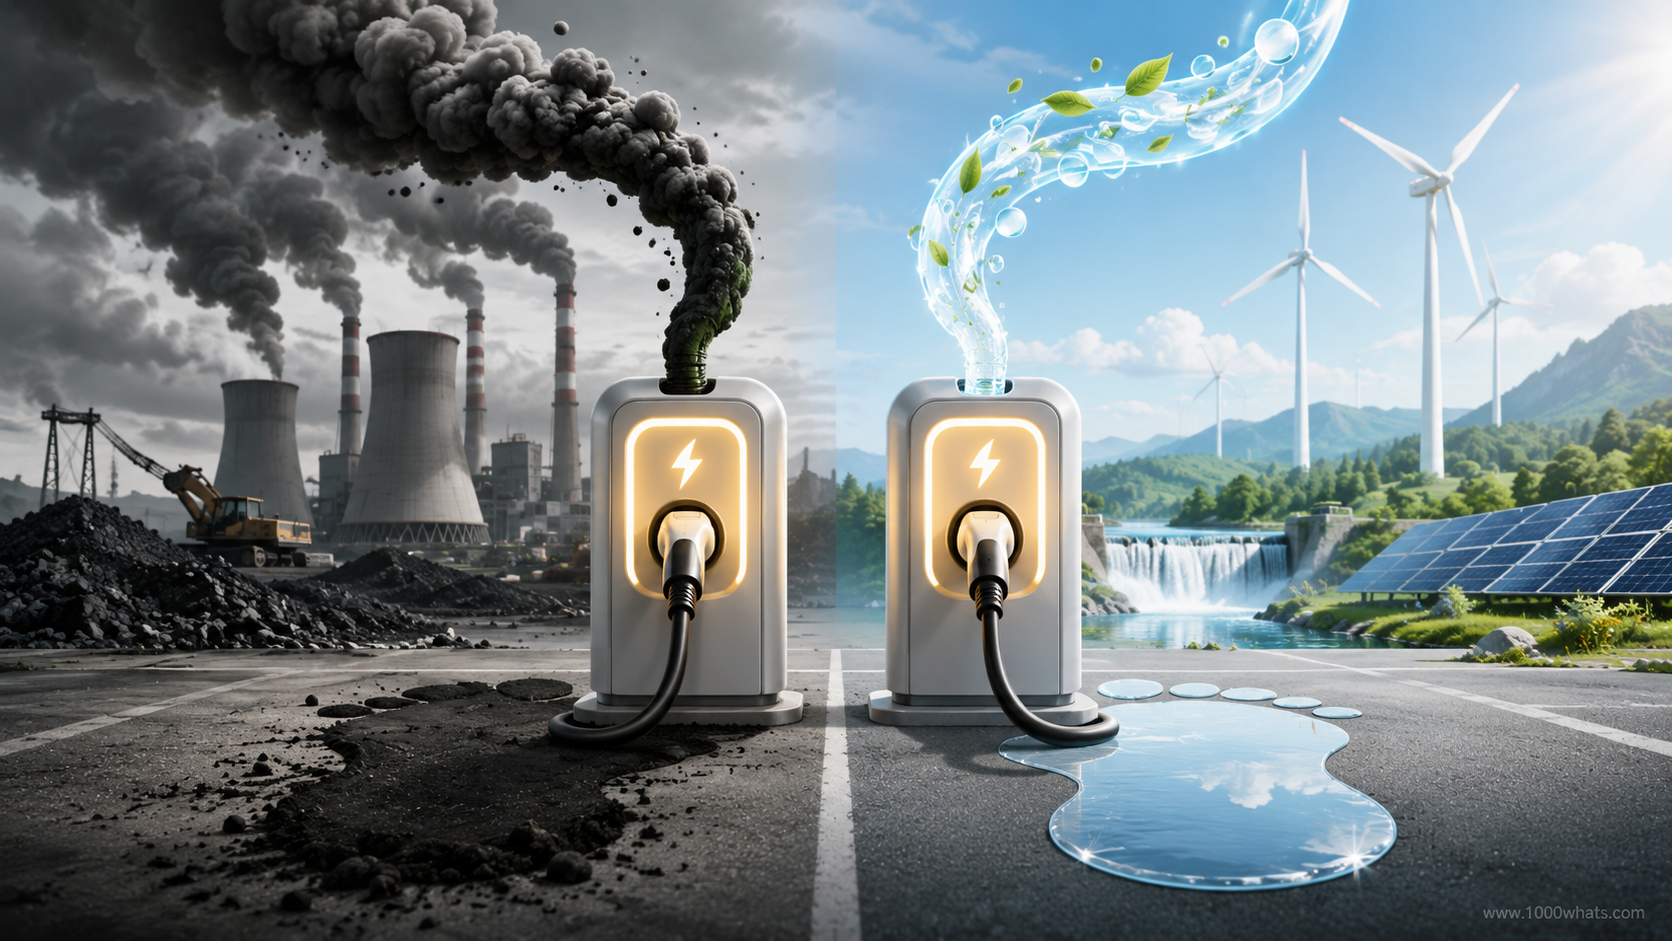
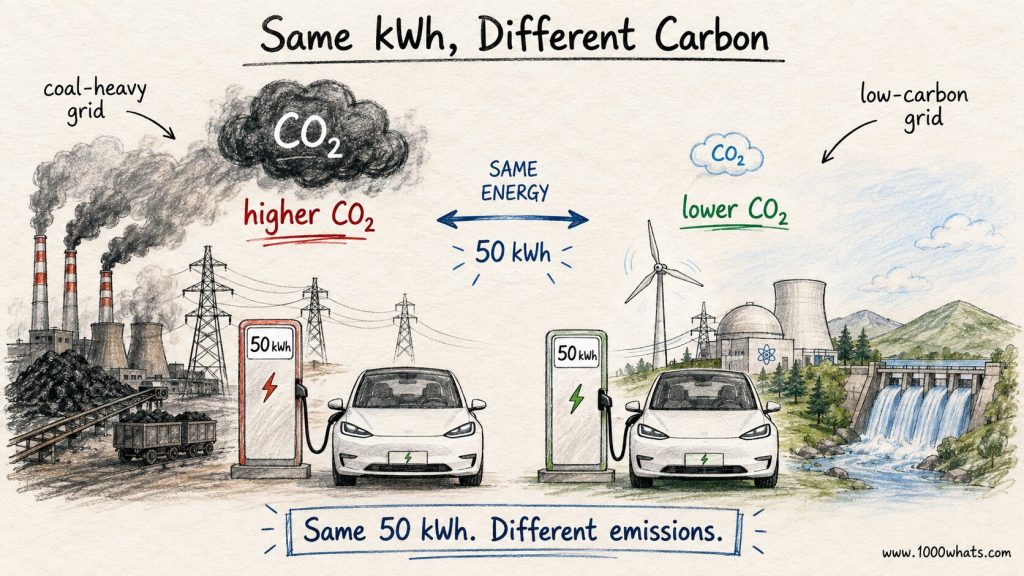
Two identical electric cars pull into two identical chargers.
Both take exactly 50 kWh from the grid.
Same cars. Same batteries. Same electricity consumption.
But one charge can be responsible for considerably more CO₂ than the other.
Nothing went wrong with the meter.
The electrons did not arrive wearing tiny coal hats.
The difference is where the electricity came from.
Charge when the grid is running heavily on coal and gas, and the emissions associated with those 50 kWh can be relatively high.
Charge when wind, solar, hydro, and nuclear dominate the mix, and they can be much lower.
The electricity still does exactly the same job.
Its climate baggage does not.
⚡ “A kilowatt-hour tells you how much electricity you used. Carbon intensity tells you what came with it.”
Welcome to 1000whats — where today we’re attaching an emissions label to something that normally arrives without packaging.
That label is carbon intensity.
What is carbon intensity?
At its simplest:
Carbon intensity tells us how much carbon dioxide—or greenhouse-gas emissions—are associated with producing a unit of something.
For electricity, it is usually expressed as:
grams of CO₂ per kilowatt-hour
or:
gCO₂/kWh
You may also see gCO₂e/kWh, where CO₂e means carbon-dioxide equivalent and includes other greenhouse gases converted into a common climate-impact unit.
The basic calculation is wonderfully unglamorous:
Carbon intensity = emissions / output
For electricity:
CO₂ emissions / electricity generated
So imagine a power system produces 1,000 kWh of electricity and emits 400 kg of CO₂ while doing it.
400 kg is 400,000 grams.
Divide that by 1,000 kWh:
400 gCO₂/kWh
That is the average carbon intensity of the electricity generated during that period.
Simple formula.
Very useful number.
But carbon intensity is not total emissions
This distinction matters.
Suppose Country A produces:
100 TWh at 100 gCO₂/kWh
Country B produces:
10 TWh at 500 gCO₂/kWh
Country B has much dirtier electricity per kilowatt-hour.
But Country A produces ten times as much electricity.
So which country emits more in total?
Country A:
100 TWh × 100 gCO₂/kWh = 10 million tonnes of CO₂
Country B:
10 TWh × 500 gCO₂/kWh = 5 million tonnes of CO₂
Country A has lower carbon intensity but higher total emissions.
That is not a contradiction.
It is the same reason a fuel-efficient car driven 100,000 miles can burn more fuel than a gas-guzzler driven 1,000 miles.
Intensity measures emissions relative to something.
Total emissions measure the whole pile.
⚡ “Carbon intensity tells you how dirty each unit is. Total emissions tell you how big the mess became.”
This distinction becomes important whenever somebody says:
“Our emissions intensity fell.”
Good.
But the next question should be:
What happened to total emissions?
If output grew fast enough, total emissions may still have increased.
Why can electricity have different carbon intensities?
Because electricity is not a primary energy source sitting underground waiting to be dug up.
We make it from other forms of energy.
Coal.
Natural gas.
Uranium.
Wind.
Sunlight.
Water.
Biomass.
Geothermal heat.
And those technologies have very different emissions profiles.
A coal plant burns carbon-rich fuel to create heat, producing substantial CO₂ directly at the plant.
A gas turbine also burns fossil fuel, although typically with lower direct CO₂ emissions per kWh than coal.
Wind turbines and solar panels do not burn fuel while generating electricity.
Neither do nuclear reactors emit CO₂ from combustion during operation.
So the carbon intensity of a grid depends heavily on which generators are actually producing electricity.
A coal-heavy system will generally have high carbon intensity.
A system dominated by hydro, wind, solar, and nuclear will generally have much lower operational carbon intensity.
And most grids sit somewhere in between.
The electricity mix is the recipe
Imagine electricity as soup.
Yes, we are going there.
Your national grid is one enormous pot.
Into it go different ingredients:
- 30% wind
- 20% nuclear
- 15% hydro
- 25% gas
- 10% coal
Each ingredient has a different emissions profile.
The final carbon intensity depends on the mix.
Add more coal and the number usually rises.
Replace coal generation with wind, nuclear, hydro, or solar and it usually falls.
Replace coal with gas and it can also fall, although the system remains dependent on a fossil fuel.
This is why carbon intensity is such a useful measure of power-sector decarbonization.
It tells us something total renewable capacity cannot.
You can install enormous amounts of solar and wind while still retaining substantial fossil generation.
Carbon intensity tells you whether the electricity actually being produced is becoming less carbon-heavy.
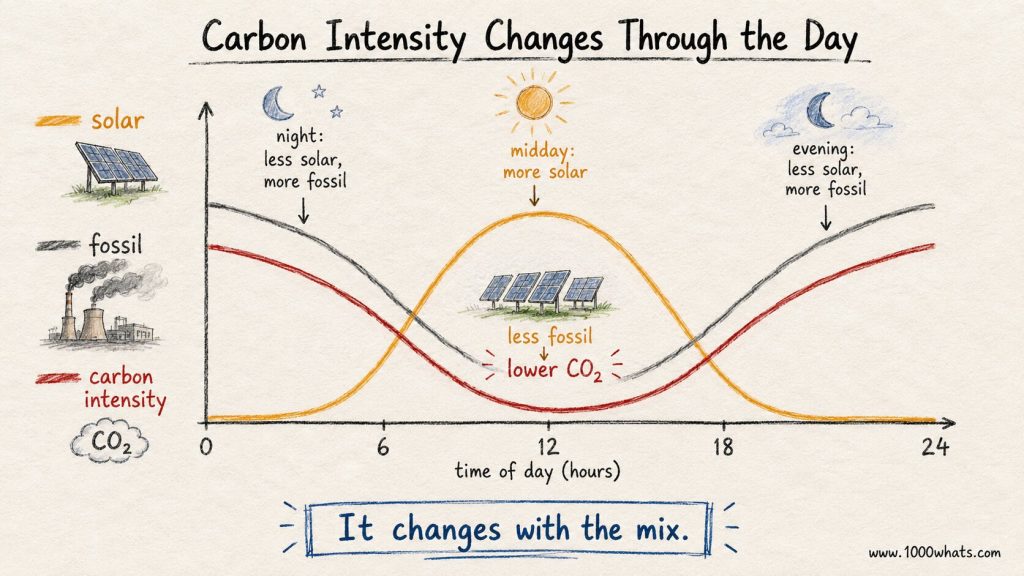
And here is the fun part: carbon intensity moves
A country’s carbon intensity is not one permanent number tattooed onto its grid.
It changes.
Sometimes dramatically.
Imagine a windy Sunday afternoon.
Demand is modest.
Wind farms are producing heavily.
Solar is contributing.
Coal and gas plants are pushed down.
Carbon intensity falls.
Now imagine a freezing, windless winter evening.
Solar production is zero.
Demand is high.
Gas and coal plants increase production.
Carbon intensity rises.
Same grid. Different hour. Different carbon intensity.
That opens an interesting possibility.
Instead of asking only:
How much electricity do we consume?
we can also ask:
When should we consume it?
Your washing machine has entered climate policy
This sounds slightly ridiculous.
It isn’t.
Suppose your washing machine needs 1 kWh for a cycle.
Run it at 7 p.m. when electricity carbon intensity is:
400 gCO₂/kWh
and that electricity corresponds to roughly 400 grams of operational power-sector CO₂.
Run the same cycle at 2 p.m. when abundant solar and wind have pushed intensity to:
100 gCO₂/kWh
and the number becomes roughly 100 grams.
Same machine.
Same clothes.
Same 1 kWh.
Different emissions associated with supplying it.
For one washing machine, the difference is tiny.
Now replace the washing machine with:
- millions of EVs,
- industrial electrolyzers,
- heat pumps,
- data centers,
- battery systems,
- industrial furnaces.
Suddenly, when electricity is consumed starts to matter at system scale.
This is sometimes called carbon-aware consumption.
Flexible consumers can shift demand toward periods when electricity is cheaper, cleaner, or ideally both.
The clean-energy transition is therefore not only about changing how electricity is produced.
It is increasingly about teaching demand to move too.
A real-world example: Europe is getting cleaner
This is not merely theoretical.
It fell another 11% in 2024 alone compared with 2023.
Why?
The generation mix changed.
More wind.
More solar.
Higher nuclear output compared with the preceding years.
Less coal.
That is what power-sector decarbonization looks like when translated into one number.
But Europe is not one homogeneous electrical soup.
The EEA notes large differences between countries.
Sweden and Finland, with large amounts of low-carbon generation, sit toward the low-intensity end.
Countries still relying heavily on solid fossil fuels sit much higher.
A kilowatt-hour therefore does not come with the same emissions profile simply because both countries use the same unit.
Physics makes the kWh identical. The generation mix gives it a history.
The global number tells another interesting story
It expects that figure to continue falling as renewables and nuclear generation expand.
But here is the important part:
Global electricity demand is also growing.
Fast.
So carbon intensity can fall while total power-sector emissions remain stubbornly high.
In fact, the IEA says global power-generation CO₂ emissions were broadly flat in 2025 even as carbon intensity declined.
This is exactly why intensity and absolute emissions need to be read together.
Imagine making every pizza 20% smaller while selling 30% more pizzas.
You have reduced the pizza intensity.
You have not necessarily reduced the cheese bill.
Decarbonization has the same arithmetic problem.
Cleaner electricity helps enormously.
But if electricity demand grows quickly, carbon intensity has to fall fast enough to outrun that growth if total emissions are to decline.
Wait—do solar and wind really have zero carbon intensity?
Ah.
Now we reach the part where apparently simple numbers become energy-sector numbers.
Solar and wind have essentially zero direct operational CO₂ emissions from fuel combustion.
But manufacturing solar panels requires materials and energy.
Wind turbines require steel, concrete, copper, transport, installation, and eventually decommissioning.
Nuclear plants require construction and uranium mining and processing.
Hydropower requires dams and reservoirs, and some reservoirs can produce methane.
So if we calculate emissions across the entire lifecycle, none of these technologies is literally emission-free.
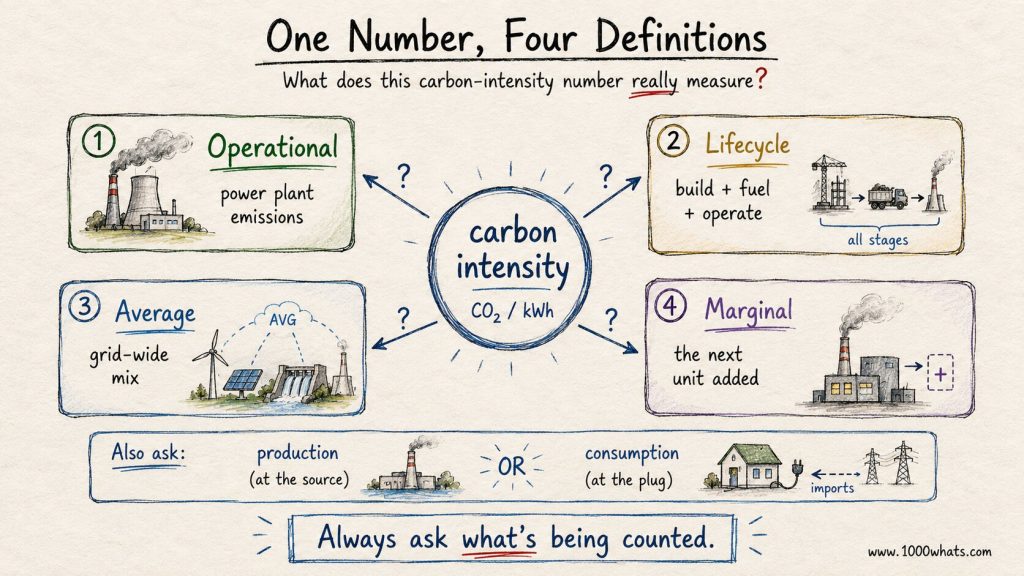
This gives us two different questions.
Operational carbon intensity
What emissions occur while electricity is actually being generated?
For wind, solar, and nuclear, direct operational CO₂ emissions are essentially zero.
For coal and gas, they are substantial.
Lifecycle carbon intensity
What emissions occurred across the whole chain?
That can include:
- raw materials
- equipment manufacturing
- construction
- fuel extraction
- transport
- operation
- maintenance
- decommissioning
Now wind, solar, hydro, and nuclear have numbers above zero.
But they generally remain dramatically below fossil generation.
This is why you should always ask what boundary a carbon-intensity figure is using.
Operational?
Lifecycle?
CO₂ only?
All greenhouse gases in CO₂e?
Numbers without definitions have a habit of starting arguments they cannot finish.
Average carbon intensity is not the whole story either
Here comes another layer.
Suppose your country’s average electricity carbon intensity today is:
200 gCO₂/kWh
You plug in your EV.
Does that automatically mean each additional kWh used by the car causes exactly 200 grams of CO₂?
Not necessarily.
The average carbon intensity tells you the emissions associated with the average electricity mix.
But the additional generator responding to an increase in demand may be different from the average mix.
Imagine a grid running:
lots of nuclear + wind + hydro + one gas plant adjusting its output.
The average grid may be relatively clean.
But if the gas plant is the unit increasing production when your extra demand appears, the marginal emissions associated with that additional consumption can be higher than the average.
This distinction matters enormously in serious carbon accounting and demand-response analysis.
Average intensity asks:
What is the emissions profile of the electricity mix overall?
Marginal intensity asks:
What changes because I consume one more kWh right now?
Those are related questions.
They are not identical.
And yes, the rabbit hole continues.
Production-based vs. consumption-based carbon intensity
Interconnectors make things even more entertaining.
Imagine Country A produces mostly clean electricity.
Country B produces mostly fossil electricity.
Country A imports heavily from Country B during a particular hour.
What is Country A’s carbon intensity?
If you measure only electricity generated inside Country A, you get one answer.
If you include the emissions associated with imported electricity actually consumed in Country A, you may get another.
That is the difference between production-based and consumption-based approaches.
In interconnected electricity markets, electrons do not stop at the border to have their passports stamped.
Power flows.
Markets couple.
Countries import and export.
So a country’s domestic generation mix and the carbon content of the electricity its consumers effectively draw from the wider system can diverge.
What looks like one simple number has now become:
Which emissions?
Whose electricity?
Which hour?
Which accounting boundary?
Welcome to energy.
Carbon intensity is useful precisely because electricity is becoming more important
If we were not electrifying anything, this would still be an interesting metric.
But we are.
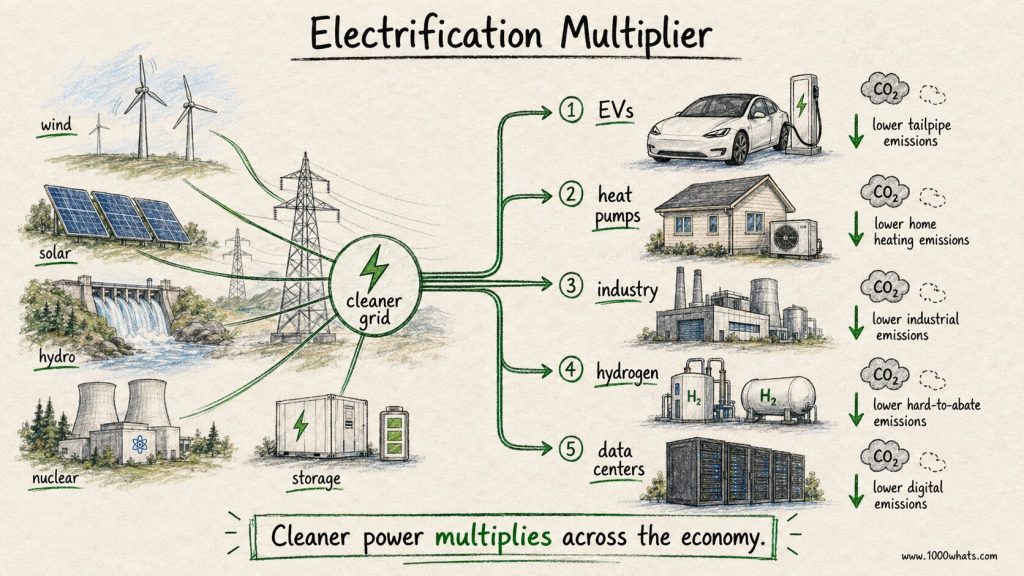
Transport is electrifying.
Heating is electrifying.
Parts of industry are electrifying.
Hydrogen may increasingly be produced using electricity.
AI and data centers are consuming growing amounts of it.
That means the carbon intensity of electricity increasingly affects the emissions of other sectors.
An electric car running on a low-carbon grid can have a very different operational emissions profile from one charged on a coal-heavy grid.
Green hydrogen produced with genuinely low-carbon electricity is a very different product from hydrogen produced using carbon-intensive electricity.
Electric heating becomes more climate-friendly as the grid decarbonizes.
This is why cleaning up electricity has such enormous leverage.
You are not merely decarbonizing power plants.
You are cleaning the energy input for cars, buildings, factories, and potentially whole new industries.
From a system perspective, that is where carbon intensity becomes much more than an environmental scorecard.
It becomes a measure of how useful electrification is as a decarbonization tool.
Is lower carbon intensity always better?
From a climate perspective, lower greenhouse-gas intensity is generally better.
But carbon intensity tells you only one thing.
It does not tell you:
- whether electricity is affordable,
- whether the grid is reliable,
- how much land infrastructure uses,
- how much material it requires,
- whether supply chains are sustainable,
- whether a project is financially viable,
- whether communities accept it,
- whether enough electricity is available when needed.
A grid with very low carbon intensity that regularly collapses is not an impressive energy system.
Neither is a perfectly reliable grid whose emissions make climate goals impossible.
The serious challenge is doing several things at once:
cleaner + reliable + affordable + scalable.
Energy has always been annoyingly multi-objective.
Anyone offering one metric that solves the whole sector is probably about to sell you a consultancy deck.
So, what is carbon intensity in one sentence?
Carbon intensity measures how much CO₂ or greenhouse-gas emissions are associated with each unit of output—such as one kilowatt-hour of electricity.
For electricity, lower carbon intensity generally means a cleaner generation mix.
But remember the fine print.
Carbon intensity can be:
- operational or lifecycle,
- average or marginal,
- production-based or consumption-based,
- measured for one plant, one country, one company, or an entire system,
- calculated annually or change hour by hour.
The number is useful.
The definition behind the number is essential.
Final thoughts
There is something wonderfully strange about electricity.
Once it reaches your socket, you cannot look at a kilowatt-hour and tell whether it came from coal, wind, nuclear, hydro, gas, or sunlight.
It all runs the same kettle.
But environmentally, those kilowatt-hours can have very different histories.
Carbon intensity gives that invisible history a number.
And as electricity takes over more of transport, heating, industry, and digital infrastructure, that number matters more.
Because electrification by itself is not the endgame.
The real prize is electrification with electricity that keeps getting cleaner.
That is why a falling carbon-intensity curve may be one of the least glamorous—and most revealing—graphs in the entire energy transition.
What energy number should we pull apart next?
Until next time, stay curious! 😎
Discover more from 1000whats
Subscribe to get the latest posts sent to your email.