
The funny thing about energy projects is that everyone loves the upside until it’s time to lend money.
A developer can talk all day about sunshine, wind speeds, and long-term demand. But lenders are not financing optimism. They’re financing the probability that a project will still make enough electricity—and enough cash—when reality shows up muddy, cloudy, late, and expensive.
That’s where P50, P90, and other Pxx values come in.
These aren’t just technical labels tossed around in consultant reports. They’re the quiet numbers that shape debt terms, investor confidence, project sizing, and, in some cases, whether a project gets built at all.
⚡ “In energy finance, the real product isn’t power. It’s confidence in future power.”
Welcome to 1000whats — where energy terms lose the lab coat and learn to speak human.
What are P50, P90, and other Pxx values?
Pxx values are probability-based estimates used to describe how likely an energy project is to hit a certain production level.
The number after the “P” tells you the probability of exceedance—in other words, how likely it is that actual energy production will be at least that value.
Here’s the simple version:
- P50 = the median or “best estimate”
There’s a 50% chance actual production will be higher, and a 50% chance it will be lower. - P90 = a more conservative estimate
There’s a 90% chance the project will produce at least this amount. - P10 = a more optimistic estimate
There’s only a 10% chance production will beat this number.
So if a solar farm has:
- P10: 120,000 MWh
- P50: 110,000 MWh
- P90: 95,000 MWh
that means 110,000 MWh is the central forecast, while 95,000 MWh is the more cautious figure lenders may trust when stress-testing the project.
What most people don’t see is this: Pxx values are not really about forecasting a single number. They’re about admitting that future production is uncertain—and quantifying that uncertainty instead of pretending it doesn’t exist.
Why do these values exist?
Because energy production is never as clean as the spreadsheet.
A solar plant does not produce exactly what a brochure says. A wind farm does not care about your investor deck. Weather shifts. Equipment degrades. Maintenance happens. Grid curtailment happens. Assumptions break.
So the industry needed a better answer than: “We think this project will generate around X.”
Pxx values exist because developers, investors, insurers, and lenders all need a structured way to answer different questions:
- How much energy will this project likely produce?
- How bad could the downside be?
- How much debt can the project safely carry?
- How much confidence should we have in the forecast?
From a market perspective, Pxx values are the bridge between engineering uncertainty and financial decision-making.
How do Pxx values actually work?
At the core, Pxx values come from an energy yield assessment.
That process starts with data and assumptions such as:
- solar irradiance or wind resource data
- equipment performance
- layout and design choices
- temperature effects
- losses from shading, soiling, wake effects, downtime, or degradation
- long-term operating conditions
A simple deterministic model might say:
Energy production = Efficiency × Resource × Area
That’s neat. It’s also not enough.
In practice, serious projects move beyond a single fixed estimate and use statistical methods—often Monte Carlo simulations—to model a wide range of possible outcomes.
Instead of getting one answer, you get a distribution.
And from that distribution, you can pull your P50, P75, P90, or whatever percentile matters.
⚡ “A project forecast becomes credible the moment it stops pretending the future is tidy.”
A quick way to visualize it
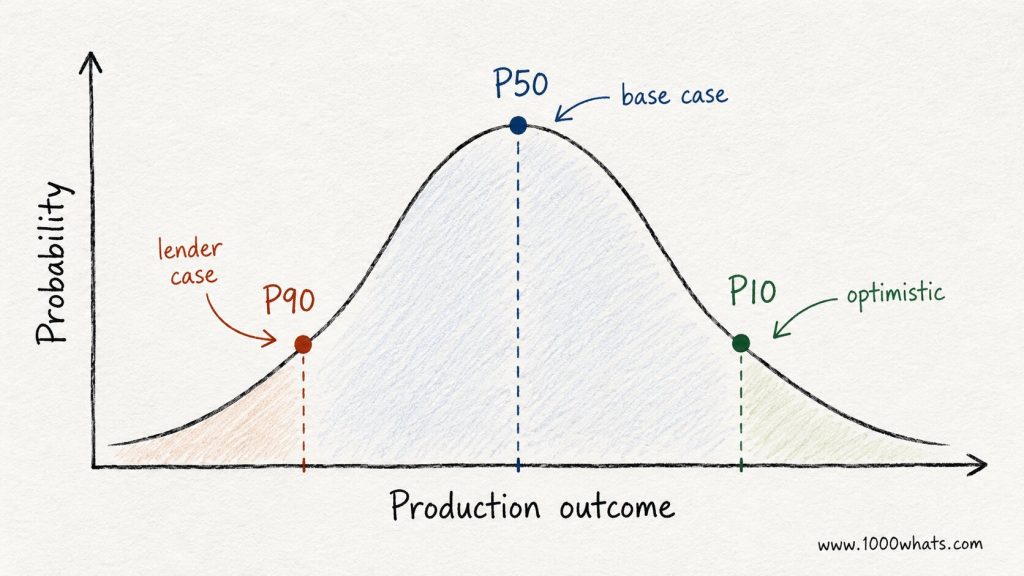
Imagine a bell curve of possible annual energy production.
- The middle of the curve is your P50
- Further into the conservative side sits P90
- On the optimistic side sits P10
That’s why P90 is lower than P50. It is designed to be more conservative, not more exciting.
Real-world example: why investors and lenders look at different P-values
Let’s say a project has these annual energy estimates:
- P50: 100 GWh
- P90: 80 GWh
Now imagine the electricity price is stable, but debt repayments are fixed.
An equity investor may focus on P50, because they want to understand the project’s expected return in a normal scenario.
A lender, on the other hand, may focus on P90, because they want to know whether the project can still cover debt when production underperforms.
That difference matters a lot.
A project can look attractive at P50 and suddenly look fragile at P90.
This is exactly why Pxx values have become so important in project finance. They help different stakeholders look at the same asset through different risk lenses.
What is a DSCR example based on P50 and P90?
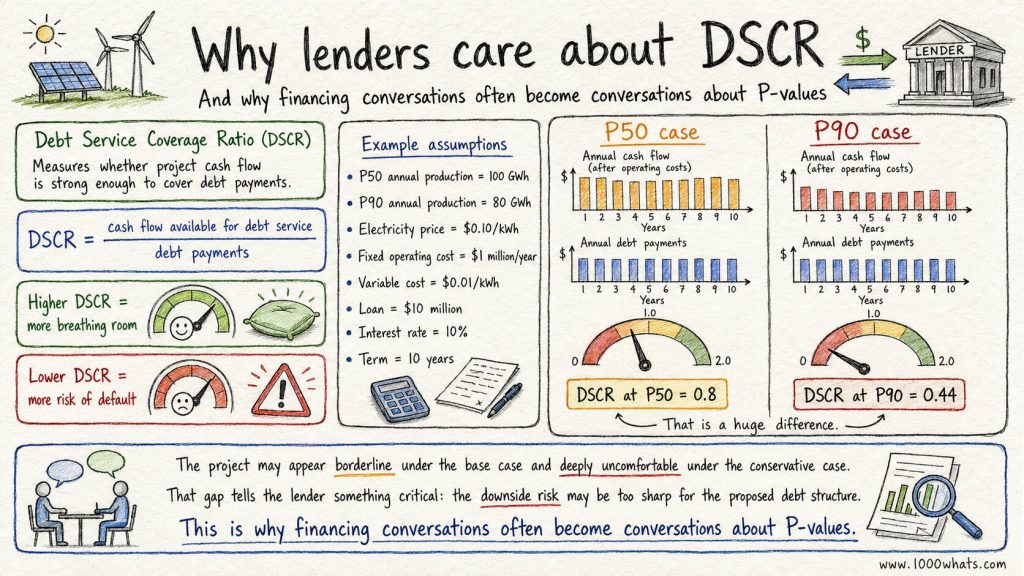
One of the classic lender metrics is the Debt Service Coverage Ratio (DSCR).
This measures whether project cash flow is strong enough to cover debt payments.
Here’s the basic logic:
- Higher DSCR = more breathing room
- Lower DSCR = more risk of default
Now suppose:
- P50 annual production = 100 GWh
- P90 annual production = 80 GWh
- electricity price = $0.10/kWh
- fixed operating cost = $1 million/year
- variable cost = $0.01/kWh
- loan = $10 million
- interest rate = 10%
- term = 10 years
Under this example:
- DSCR at P50 = 0.8
- DSCR at P90 = 0.44
That is a huge difference.
The project may appear borderline under the base case and deeply uncomfortable under the conservative case. That gap tells the lender something critical: the downside risk may be too sharp for the proposed debt structure.
This is why financing conversations often become conversations about P-values.
What are Pxx values used for in the real world?
They are used for much more than just a forecast slide in a pitch deck.
Key uses of Pxx values
- Project finance: sizing debt, negotiating interest rates, structuring repayment
- Investment decisions: comparing expected upside versus downside risk
- Insurance and guarantees: understanding performance risk
- Project design: refining layout, technology choices, and technical assumptions
- Asset management: tracking whether the project is performing in line with expectations
- Contract structuring: setting targets, penalties, or performance benchmarks
In practice, Pxx values are one of the few tools that let engineers and financiers sit in the same room and talk about the same project without speaking entirely different languages.
Pros of using P50, P90, and other Pxx values
There’s a reason these numbers are everywhere in renewable energy.
Why they’re useful
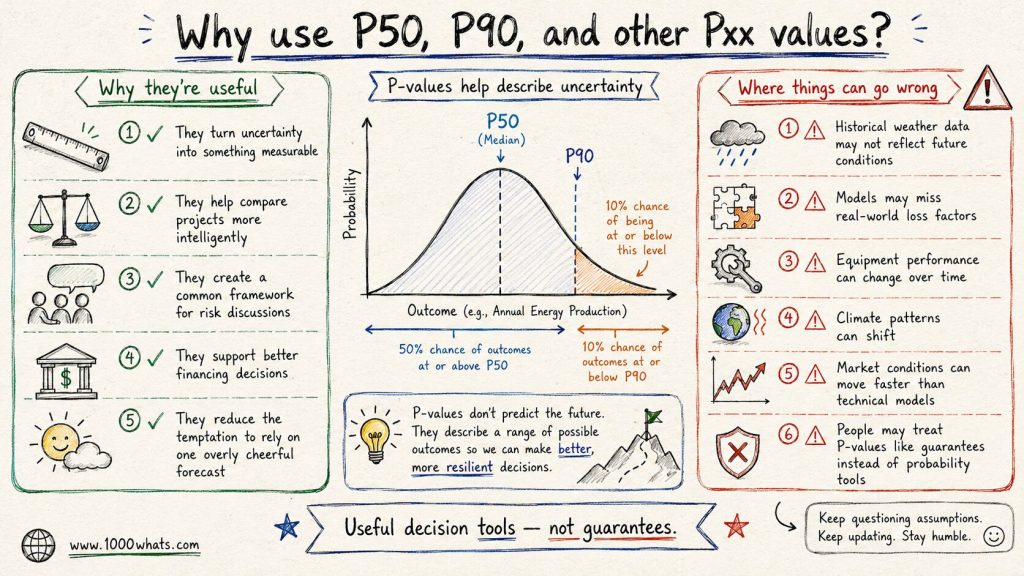
- They turn uncertainty into something measurable
- They help compare projects more intelligently
- They create a common framework for risk discussions
- They support better financing decisions
- They reduce the temptation to rely on one overly cheerful forecast
From a market perspective, this is the real win: Pxx values make projects more bankable because they give capital providers a disciplined way to price risk.
Cons and limitations nobody should ignore
Now the uncomfortable part.
Pxx values can look scientific and still be wrong.
That’s not because the concept is flawed. It’s because the output depends on the quality of the inputs, the assumptions, and the model design.
Where things can go wrong
- Historical weather data may not reflect future conditions
- Models may miss real-world loss factors
- Equipment performance can change over time
- Climate patterns can shift
- Market conditions can move faster than technical models
- People may treat P-values like guarantees instead of probability tools
⚡ “A P90 is not a promise. It’s a probability wrapped in assumptions.”
This is where people get sloppy.
What most people don’t see is that a polished P90 can create false comfort if the underlying dataset is weak, outdated, or massaged to make the deal work.
That’s why sophisticated teams do not rely on one number alone. They look at ranges, sensitivities, scenarios, and the credibility of the underlying methodology.
Why do Pxx values matter so much today?
Because the energy business is now deeply financialized.
Renewables are capital-heavy assets. Their economics depend less on fuel and more on forecast confidence, financing terms, and long-term performance assumptions. The cleaner the technology, the more brutally important the forecast can become.
That makes Pxx values more relevant than ever.
They matter today because:
- renewable projects need large upfront capital
- debt markets are more disciplined
- investors want clearer downside protection
- grid conditions are getting more complex
- weather uncertainty is becoming harder to ignore
- performance expectations are now tied to tighter financial models
In short, Pxx values matter because clean energy is no longer a side project. It’s infrastructure. And infrastructure gets financed on numbers people trust.
Final thoughts
P50, P90, and the rest of the Pxx family may sound like niche industry jargon, but they reveal something bigger about how modern energy works.
We do not build power projects based on certainty. We build them based on managed uncertainty.
That’s the real story.
A great energy project is not the one with the prettiest base-case forecast. It’s the one that still makes sense when you pressure-test the downside, challenge the assumptions, and ask what happens when the world behaves like the world.
So next time you hear someone say a project is “bankable,” look past the headline number.
Ask what their P50 is. Ask what their P90 is. Then ask which one the lender actually believes.
Got a take on how risk should be measured in energy finance? Drop it in the comments.
Until next time, stay curious! 😎
Discover more from 1000whats
Subscribe to get the latest posts sent to your email.