
Imagine you own a gas-fired power plant.
The plant works.
Gas is available.
The grid wants electricity.
The wholesale power price is:
€100/MWh.
Excellent.
Fire up the turbine.
Except the gas needed to produce that 1 MWh of electricity costs:
€110.
Congratulations.
You have just discovered a technologically sophisticated way to turn €110 into €100.
Power generation is going beautifully.
This is why electricity traders, plant operators, investors, and analysts watch something called the:
spark spread.
Welcome to 1000whats — where today we discover that a perfectly functional power station can sometimes make more money by doing absolutely nothing.
⚡ “A power plant does not run because it can produce electricity. It runs because producing electricity is worth more than the fuel it consumes.”
That difference is the spark spread.
And once you understand it, a surprising amount of electricity-market behavior starts making sense.
First, forget the power plant for a moment
Imagine a bakery.
Flour costs:
€1.00
The bread you can make from that flour sells for:
€1.50.
Ignoring every other cost for a moment, you have:
€0.50
between the value of the output and the cost of the main input.
Now flour rises to:
€1.60.
Bread still sells for:
€1.50.
Would you enthusiastically bake more?
Probably not.
A gas-fired power station faces the same basic problem.
It buys:
natural gas
and converts it into:
electricity.
The spark spread asks:
How much is the electricity worth after paying for the gas needed to make it?
The U.S. Commodity Futures Trading Commission defines the spark spread as the difference between the price of electricity and the price of the natural gas used to generate it, expressed in equivalent units.
ICE describes its German spark-spread contract even more commercially: it represents the theoretical gross margin of a gas-fired power plant from selling electricity after buying the gas required to produce it.
That word matters:
margin.
Not revenue.
Not profit.
Margin.
The basic equation is beautifully simple
At its simplest:
Spark Spread = Electricity Price − Fuel Cost per MWh of Electricity
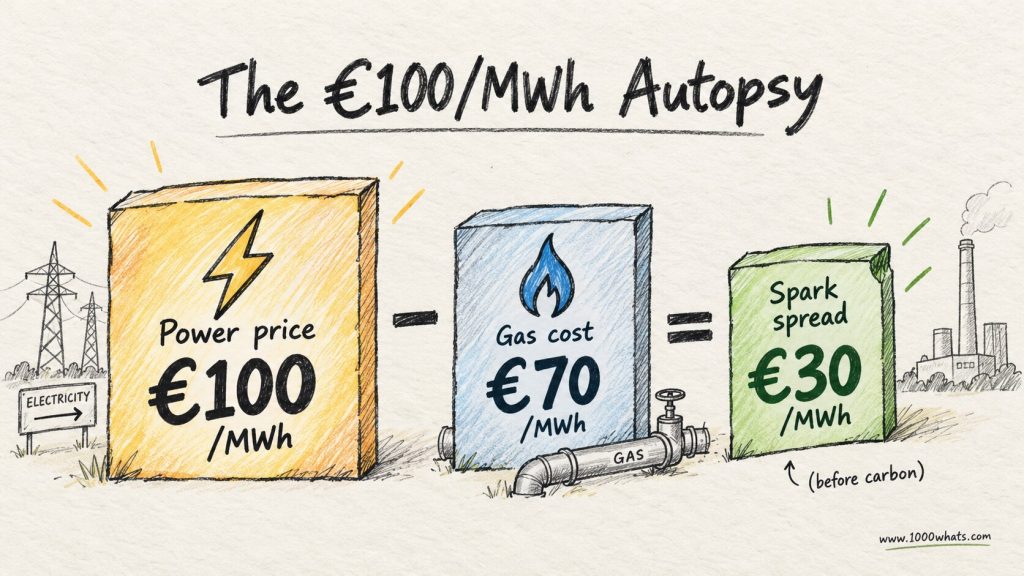
Suppose electricity trades at:
€100/MWh
and producing 1 MWh of electricity requires gas costing:
€70.
Then:
Spark Spread = €100 − €70 = €30/MWh
Very roughly, the plant has:
€30/MWh
left after paying for fuel.
Excellent.
Except we skipped one rather important detail.
How much gas does the plant need?
Efficiency changes everything
Natural gas is normally priced per unit of:
fuel energy.
Electricity is priced per:
MWh of electrical energy.
Those are not the same thing.
A power plant does not convert 100% of the gas’s chemical energy into electricity.
If it did, thermodynamics would like a meeting.
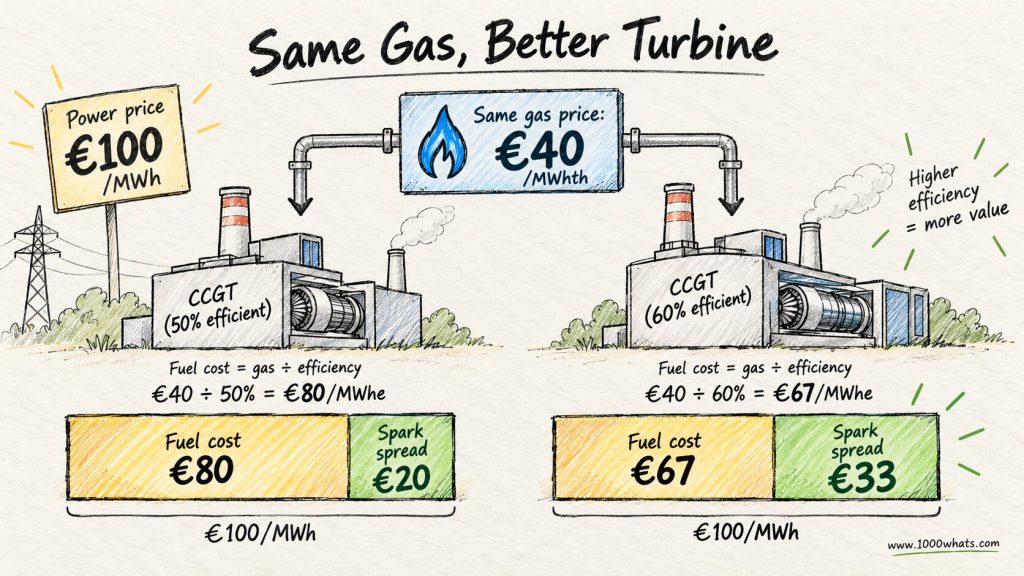
Suppose our gas plant is:
50% efficient.
To produce:
1 MWh of electricity
it needs approximately:
2 MWh of gas energy.
If gas costs:
€30/MWh thermal
then the fuel cost of producing 1 MWh electricity is:
€60/MWh electrical.
So if power sells for:
€100/MWh
our spark spread is:
€40/MWh.
Simple.
Now change only one thing.
The plant is:
60% efficient.
To make 1 MWh of electricity it needs roughly:
1.67 MWh of gas.
At the same €30/MWh gas price:
Fuel cost ≈ €50/MWh
So:
Spark spread ≈ €50/MWh
Same electricity market.
Same gas market.
Different plant.
Ten euros more gross margin per MWh because the second machine wastes less fuel.
Efficiency is not merely an engineering trophy.
It is a trading advantage.
This is where heat rate enters
In European discussions, we often express the same idea through:
efficiency.
In U.S. power markets, you will frequently hear:
heat rate.
Heat rate tells you how much fuel energy a power plant needs to produce one unit of electricity.
Lower heat rate:
better.
Higher heat rate:
worse.
A highly efficient CCGT needs less fuel per MWh than an older, less efficient gas turbine.
Our existing CCGT explainer explains why: a combined-cycle plant uses the hot exhaust from the gas turbine to produce steam and generate more electricity in a second turbine.
Same flame.
More electricity.
From a spark-spread perspective, that means:
less gas cost per MWh sold.
And therefore, all else equal:
a wider margin.
Let’s build a gas plant on a napkin
Suppose:
Power price = €120/MWh
Gas price = €40/MWh thermal
Plant efficiency = 50%
The plant needs:
2 MWh gas → 1 MWh electricity
Fuel cost:
2 × €40 = €80/MWh
Spark spread:
€120 − €80 = €40/MWh
Now power falls to:
€85/MWh.
Gas remains:
€40/MWh.
Fuel cost remains:
€80/MWh.
Spark spread:
€5/MWh.
Much less exciting.
Now electricity falls to:
€70/MWh.
Spark spread:
−€10/MWh.
The plant would spend roughly €80 on gas to make electricity worth €70.
Running now resembles a charitable contribution to the power market.
So the plant may simply:
not run.
That is an enormously important electricity-market concept.
A generator can be:
available,
connected,
technically capable,
fully staffed,
and completely uninterested in producing electricity at the current market price.
Positive spark spread = run?
Not necessarily.
This is where the simple explanation meets an actual power plant.
Suppose the spark spread is:
+€5/MWh.
Positive.
Wonderful.
But the plant also has variable operating costs.
Water treatment.
Chemicals.
Maintenance related to operating hours.
Consumables.
Start costs.
Wear from cycling.
Other variable costs.
A €5 spark spread does not automatically mean:
profitable generation.
Remember what ICE calls the spark spread:
theoretical gross margin.
The word theoretical is doing useful work.
The spark spread is a screening metric.
Real dispatch decisions use the plant’s actual economics.
⚡ “Spark spread tells you whether gas-to-power conversion looks attractive. The control room still has several pages of footnotes.”
Starting the plant costs money too
Imagine the plant is offline.
Electricity prices rise for one hour.
The spark spread becomes positive.
Should the plant start?
Maybe.
But a thermal power station is not a desk lamp.
Starting can require:
fuel,
time,
auxiliary electricity,
thermal cycling,
and additional wear.
A plant may therefore ignore a short positive-price opportunity if the expected margin is not enough to cover:
startup + operation + shutdown
over the whole period.
This is why power traders and plant optimizers care about the entire expected price path.
Not merely:
Is hour 17 profitable?
But:
If I start at 16:00, run until 22:00, and stop, does the whole trip make money?
Power plants have travel expenses too.
The spark spread is really three markets talking to each other
At first glance, spark spread looks like a gas-plant metric.
It is more interesting than that.
It connects:
the electricity market
with:
the gas market.
Power price rises?
Spark spread widens.
Gas price rises?
Spark spread narrows.
That means events that appear to belong entirely to the gas market can suddenly change electricity generation.
A pipeline outage.
Cold weather.
An LNG supply disruption.
Storage concerns.
A geopolitical event.
All can raise gas prices.
And suddenly gas-fired generators need a higher electricity price to justify running.
This is one reason gas prices can strongly influence power prices in systems where gas plants frequently sit near the marginal unit.
The gas market and electricity market are not neighboring apartments.
There is a door between them.
And Europe added a third market
Carbon.
A gas plant burns natural gas.
That produces:
CO₂.
Under the EU Emissions Trading System, covered power generators must surrender allowances corresponding to their emissions.
One EU Allowance gives the right to emit:
one tonne of CO₂ equivalent.
Power generators generally need to acquire allowances rather than simply receiving all of them for free.
So our gas plant now has another variable cost:
carbon.
And that gives us the:
clean spark spread.
The clean spark spread
The ordinary spark spread is approximately:
Power price − gas cost
The clean spark spread adds:
carbon cost.
So:
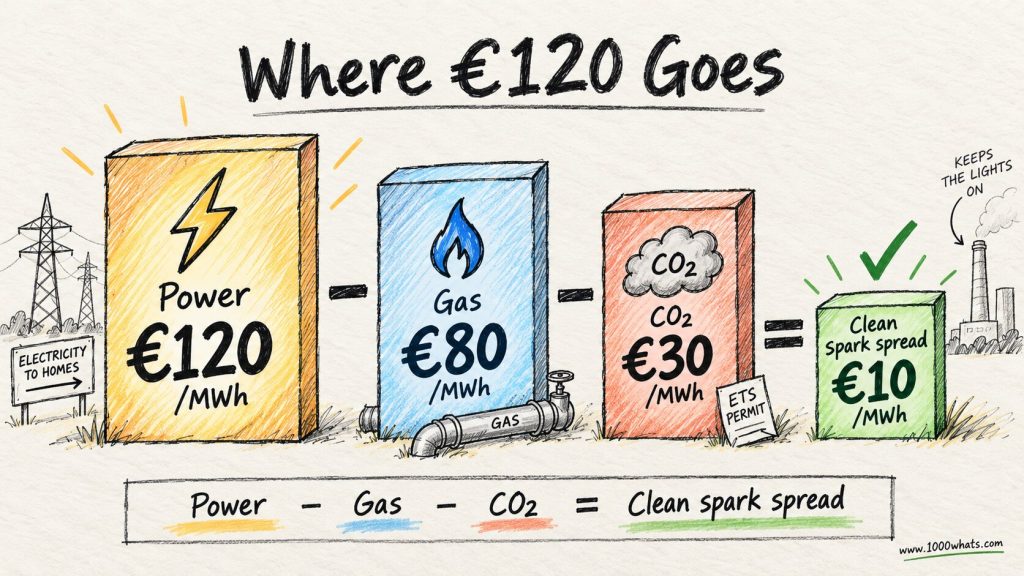
Clean Spark Spread = Power Price − Fuel Cost − CO₂ Cost
Now the real fun begins.
Suppose:
Power = €120/MWh
Gas = €40/MWh thermal
Efficiency = 50%
Fuel cost = €80/MWh electrical
Suppose the plant emits approximately:
0.4 tCO₂/MWh electrical
and carbon allowances cost:
€75/tCO₂.
Carbon cost becomes:
0.4 × €75 = €30/MWh
So:
Clean spark spread = €120 − €80 − €30
= €10/MWh
Our original spark spread was:
€40/MWh.
Carbon just removed:
€30.
Same turbine.
Same gas.
Same electricity.
Completely different commercial picture.
And this is why carbon pricing can change which power plants run without physically touching any power plant at all.
Carbon is not a theoretical footnote in Europe
The European Commission’s EU ETS auction data reports that the average allowance price over March–August 2026 was €75.99/tCO₂.
For a gas plant emitting around 0.35–0.40 tCO₂ per MWh, a carbon price around that level can represent roughly:
€27–30/MWh
of generation cost.
That is not rounding error.
That is dispatch economics.
It also means Europe’s electricity market is simultaneously reacting to:
power prices,
gas prices,
plant efficiency,
and carbon prices.
If you have ever wondered why thermal-generation economics occasionally look like somebody connected three Bloomberg screens with string—
they basically did.
A more efficient gas plant wins twice
Now compare two plants.
Plant A:
50% efficient
Plant B:
60% efficient
Both buy the same gas.
We already know Plant B needs less gas per MWh.
But there is another advantage.
Burn less gas:
emit less CO₂ per MWh.
So the more efficient plant pays:
less for fuel
and
less for carbon.
Efficiency therefore widens the clean spark spread twice.
This matters enormously in competitive dispatch.
An older gas plant may be perfectly functional.
A newer CCGT may simply be able to produce the same MWh more cheaply.
The electricity market has no sentimental attachment to vintage turbines.
Now we can understand dispatch much better
Imagine three gas plants.
| Plant | Efficiency | Fuel + carbon cost | Power price | Margin before other variable costs |
|---|---|---|---|---|
| Old gas plant | 42% | €115/MWh | €110/MWh | −€5/MWh |
| Mid-efficiency CCGT | 52% | €96/MWh | €110/MWh | €14/MWh |
| Modern CCGT | 60% | €86/MWh | €110/MWh | €24/MWh |
Same market price.
Same gas market.
Same carbon price.
Three completely different answers to:
Should we run?
This is why saying:
“gas plants are profitable today”
can be almost meaningless.
Which gas plant?
At what efficiency?
At which gas hub?
At which electricity price?
At what carbon price?
During which hour?
Energy markets dislike universal statements almost as much as engineers do.
Spark spread connects directly to the merit order
Our electricity market dispatch logic depends heavily on:
marginal cost.
A generator with lower variable cost can economically offer power at a lower price.
If gas becomes expensive, gas plants move up the cost stack.
If gas becomes cheap, they move down.
If carbon becomes expensive, higher-emitting generators become less competitive.
If electricity prices rise while gas and carbon remain stable, gas generation becomes more attractive.
The spark spread is therefore the gas generator’s view of the same economics.
The market asks:
What does this MWh cost to produce?
The generator asks:
What margin do I make if I produce it?
Same relationship.
Different side of the spreadsheet.
This is also why gas can set the electricity price
Suppose demand is high.
Wind, solar, nuclear, hydro, and cheaper generators are already producing.
The system still needs another:
500 MW.
A gas plant is the next available generator.
It needs approximately:
€70/MWh gas cost
€30/MWh carbon
other variable costs
to justify producing.
Its economic offer may therefore sit above:
€100/MWh.
If that plant becomes marginal, the electricity market price can move toward the level needed to bring it online.
Now gas prices matter to everybody.
Including consumers whose electricity did not physically come from a gas molecule.
This often causes confusion.
People ask:
Why did my electricity price rise when most electricity came from nuclear, hydro, wind, or solar?
Because wholesale market prices are not determined by the average production cost of every MWh.
They are heavily influenced by the cost of the marginal MWh needed to balance supply and demand.
If that MWh comes from gas:
the gas market just entered your electricity bill.
The spark spread can turn negative surprisingly fast
Suppose:
Power = €100/MWh
Gas = €30/MWh
Efficiency = 60%
Fuel cost ≈ €50/MWh
Carbon = €28/MWh
Clean spark spread:
€22/MWh
Nice.
Then gas rises to:
€45/MWh.
Fuel cost becomes:
€75/MWh.
Carbon remains:
€28/MWh.
Clean spark spread:
−€3/MWh.
Nothing happened to the power plant.
The turbine did not become less efficient.
The operator did not suddenly forget how electricity works.
The relationship between three commodity prices changed.
The machine became economically unattractive without changing physically at all.
That is what makes energy trading so interesting.
The steel stays still.
The economics move underneath it.
Renewable generation can squeeze the spread from the other side
Gas price does not need to rise for spark spreads to collapse.
Electricity prices can fall.
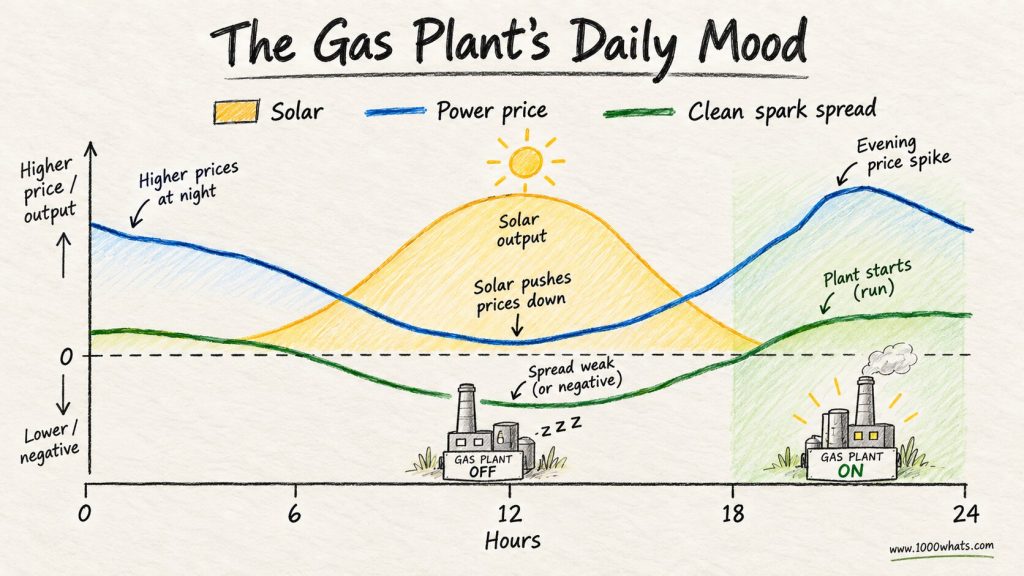
Imagine a windy, sunny Sunday afternoon.
Demand is modest.
Wind output is high.
Solar output is high.
Hydro is available.
Electricity prices fall sharply.
Gas price stays unchanged.
Carbon price stays unchanged.
Now the spark spread narrows because:
the output became cheaper
rather than because:
the input became more expensive.
At sufficiently low electricity prices, gas plants shut down.
This is one of the mechanisms through which renewables reduce thermal generation.
Not by sending someone to the gas plant with an OFF switch.
They change the economics.
The plant switches itself off.
Then evening arrives
Solar disappears.
Demand remains high.
Wind may or may not cooperate.
Electricity prices rise.
Gas and carbon costs have not changed.
Suddenly:
the clean spark spread widens.
The gas plant comes back.
This is why flexible CCGTs can move between:
not economic,
economic,
not economic,
economic
within the same day.
From the outside, it looks like:
power plant cycling.
From the trading desk, it looks like:
the spread moved.
Same event.
Two languages.
Real-world Europe: gas still matters
Gas-fired generation is declining structurally in parts of Europe as renewable output grows, but it has not become commercially irrelevant.
The IEA’s latest electricity outlook expects EU gas-fired generation to decline under normal renewable and hydrological conditions in 2026 after a stronger role during periods of weak wind and hydro output.
Meanwhile, ACER’s 2026 gas-market monitoring found gas-fired plants were economically competitive in roughly 40% of hours in 2025.
That is precisely why spark spread remains useful.
The interesting question is no longer simply:
Do we have gas plants?
It is:
During which hours does the relationship between electricity, gas, carbon, and plant efficiency make them economic?
That is a much more useful market question.
A power plant can hedge the spread
So far we have treated electricity and gas prices as things the plant simply observes.
Traders are less passive.
Suppose a generator worries that six months from now:
electricity prices might fall,
or:
gas prices might rise.
Either event could destroy its margin.
So the generator can hedge.
Conceptually, it can:
sell electricity forward
and:
buy gas forward.
That locks in much of the relationship between future output revenue and fuel cost.
Spark spread is therefore not merely an analytical number.
It can itself become something traded.
ICE’s German Spark Spread contract simultaneously creates positions in German power and TTF gas futures.
Its UK equivalent similarly combines UK power and NBP gas futures.
This is energy trading at its most conceptually elegant.
The trader is not really betting on:
gas.
Or:
electricity.
The trader is managing the relationship between them.
But hedging gas and power still leaves carbon
Welcome back to Europe.
If carbon prices can move too, then locking:
power revenue
and:
gas cost
does not necessarily lock the:
clean spark spread.
Carbon exposure remains.
So a European gas generator may need to think about:
electricity hedges,
gas hedges,
and:
EUA hedges.
Three markets.
One power plant.
The turbine remains blissfully unaware of all this.
It just spins when instructed.
Spark spread is not the same thing as profit
This distinction is worth making explicit.
Suppose clean spark spread is:
€20/MWh.
Does the plant earn €20/MWh profit?
No.
That €20 still has to contribute toward costs such as:
variable O&M,
start costs,
maintenance,
staff,
insurance,
fixed O&M,
financing,
capital recovery,
and other expenses.
Spark spread is therefore much closer to:
gross generation margin
than:
net corporate profit.
A plant can have a positive spark spread and still be a terrible investment.
A plant can also have weak annual utilization but remain valuable because it earns large margins during a relatively small number of scarcity hours.
This is where simple spread analysis eventually meets my existing article on bankability.
Lenders are not impressed that a plant made €80/MWh for four spectacular hours last Tuesday.
They tend to ask what happens for the next fifteen years.
Spoilsports.
And spark spread is not capture price
Another distinction matters.
Spark spread asks:
What margin can a gas plant earn by converting gas into electricity?
Capture price asks something different:
What average electricity price does a generator actually receive given the hours when it produces?
A solar plant can suffer a falling capture price because solar-heavy hours become cheap.
A gas plant can suffer a weak spark spread because power prices are too low relative to gas and carbon.
Both are about market value.
But the mechanisms are different.
This is exactly why energy markets need more than one metric.
Unfortunately for anyone hoping to run a power system from a single Excel cell.
Spark spread vs. clean spark spread
The distinction is simple enough to keep.
| Metric | Subtracts gas cost? | Subtracts carbon cost? | What it roughly shows |
|---|---|---|---|
| Spark spread | Yes | No | Gross gas-to-power conversion margin |
| Clean spark spread | Yes | Yes | Carbon-adjusted gas-to-power margin |
In Europe:
clean spark spread is usually the more economically meaningful metric.
Carbon has a price.
Ignoring it does not make the cost disappear.
It merely improves the spreadsheet.
There is a coal version too
Naturally.
For coal-fired power generation, the equivalent is called:
dark spread.
Add carbon:
clean dark spread.
Now compare:
clean spark spread
with:
clean dark spread.
You begin to see whether gas or coal has the stronger short-run generation economics.
Carbon prices matter enormously here because coal emits substantially more CO₂ per MWh than efficient gas generation.
Raise carbon prices and, all else equal:
coal’s clean margin deteriorates faster.
That can influence:
coal-to-gas switching.
Again, carbon policy changes dispatch through economics.
Nobody needs to physically ban the coal plant from turning on.
Make the emissions expensive enough and the market starts having opinions.
The metric has limitations
Spark spread is useful precisely because it simplifies.
That is also its weakness.
A generic market spark spread may assume:
a standard plant efficiency,
a particular gas hub,
a particular power market,
a particular delivery period.
Your actual plant may have:
different efficiency,
different gas transportation costs,
different emissions intensity,
different startup costs,
different operating constraints,
different electricity-market access,
different flexibility.
ICE’s German spark-spread contract, for example, uses a standardized 50% heat-rate efficiency assumption for its calculation.
A modern CCGT may perform materially better.
An older plant may perform worse.
So published spark spread tells you:
what a representative plant might see.
Asset optimization asks:
what does my actual plant see?
That difference can be worth millions.
What most people don’t see: the plant is an option
Here is perhaps the most interesting way to think about a gas plant.
It is not merely:
a machine that produces electricity.
It is also:
an option to convert gas into electricity when that conversion becomes valuable.
If:
electricity value > gas + carbon + operating cost
exercise the option.
Run.
If not:
leave the option unused.
Wait.
This is why flexibility matters.
A plant that can start quickly and ramp efficiently can exploit short periods of attractive spreads better than a plant requiring many hours to start.
Two plants with identical peak efficiency may therefore have different commercial value.
One can catch the price spike.
The other is still warming up when the party ends.
⚡ “A flexible gas plant is not valuable because it runs all the time. It is valuable because it can run when the spread says yes.”
That is a much better way to understand modern thermal generation.
Why spark spread matters in a renewable-heavy grid
At first glance, spark spread sounds like an old fossil-fuel concept.
In reality, more variable renewable generation can make the metric more interesting.
Solar and wind can push electricity prices very low during high-output periods.
Gas plants shut down.
Then renewable output falls.
Residual demand rises.
Power prices can rise quickly.
Gas plants start.
So instead of running:
8,000 hours at a modest margin
a flexible thermal plant may increasingly depend on:
fewer hours with stronger margins.
That changes:
dispatch,
maintenance,
startup patterns,
hedging,
financing,
and plant valuation.
The energy transition does not merely change how much gas generation exists.
It changes the commercial shape of the hours in which gas generation operates.
Spark spread sits right in the middle of that story.
So, what is a spark spread in one sentence?
The spark spread is the difference between the market value of electricity and the cost of the natural gas required to generate it, adjusted for the power plant’s efficiency.
And:
clean spark spread additionally subtracts the cost of carbon emissions.
But the better mental model is:
Spark spread answers whether turning gas into electricity is economically worth doing right now.
Positive enough?
Run.
Negative?
Maybe go make coffee.
The turbine can wait.
Final thoughts
Power plants look like engineering.
Concrete.
Steel.
Compressors.
Turbines.
Transformers.
Pipes.
Cooling systems.
And they are.
But once the plant connects to an electricity market, another machine appears around it.
A machine made of prices.
Electricity price.
Gas price.
Carbon price.
Efficiency.
Startup cost.
Flexibility.
Every hour, those numbers quietly decide whether billions of euros of physical infrastructure should:
run,
ramp,
shut down,
or sit there doing absolutely nothing.
That is what makes the spark spread such a useful little concept.
It takes three enormous markets and compresses them into one brutally practical question:
If I buy this gas and turn it into electricity, is there anything left for me afterward?
Sometimes the answer is:
€50/MWh.
Sometimes:
€5.
Sometimes:
minus €20.
Same power station.
Same turbine.
Same engineers.
Different Tuesday.
And somewhere on a trading floor, someone is staring at the number and deciding whether several hundred megawatts should exist for the next hour.
Electricity markets are strange like that.
Until next time, stay curious! 😎
Discover more from 1000whats
Subscribe to get the latest posts sent to your email.