
Imagine the wholesale electricity price averaged:
€80/MWh
last year.
You own a solar farm.
It generated:
100,000 MWh.
Excellent.
€80 × 100,000 = €8 million.
Except your revenue was closer to:
€6 million.
No electricity disappeared.
Nobody misplaced €2 million behind the inverter.
The problem is much simpler.
Your solar farm did not generate electricity during the average hour.
It generated when the Sun was shining.
And unfortunately, so did every other solar plant.
Welcome to 1000whats – where today we discover why the average electricity price may have surprisingly little to do with the price a power plant actually earns.
The missing concept is:
capture price.
And if you work with renewable energy projects, PPAs or merchant revenue, it is one of those numbers you eventually stop being able to unsee.
⚡ “The market does not pay a power plant the annual average price. It pays whatever electricity is worth during the hours when that plant actually produces.”
Start with the average price
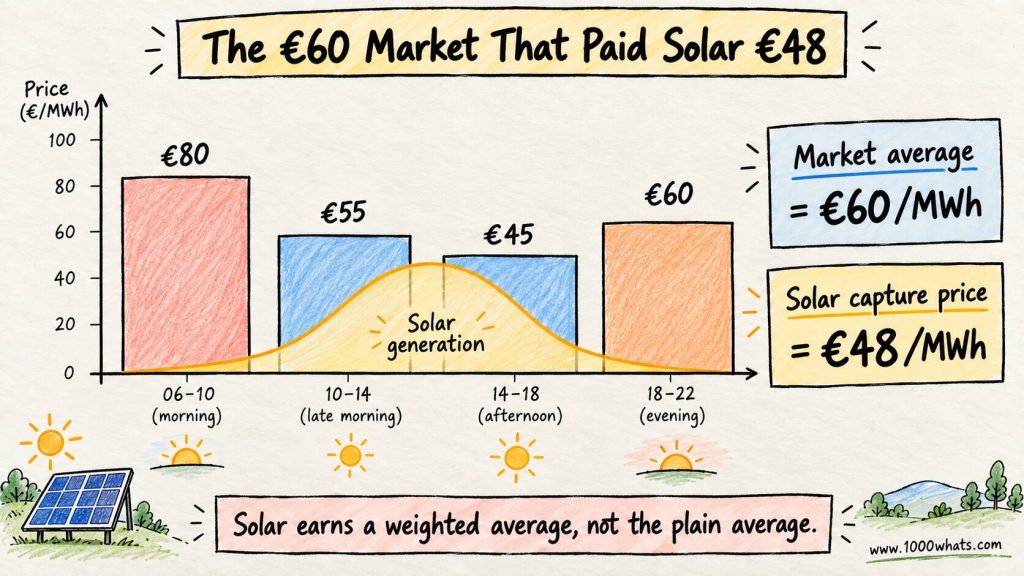
Suppose a tiny electricity market has only four hours.
| Hour | Market price |
|---|---|
| 10:00 | €100/MWh |
| 11:00 | €80/MWh |
| 12:00 | €40/MWh |
| 13:00 | €20/MWh |
The simple average market price is:
€60/MWh.
Easy.
Now add a solar farm.
Its production looks like this:
| Hour | Market price | Solar generation |
|---|---|---|
| 10:00 | €100/MWh | 10 MWh |
| 11:00 | €80/MWh | 20 MWh |
| 12:00 | €40/MWh | 40 MWh |
| 13:00 | €20/MWh | 30 MWh |
Total production:
100 MWh.
If you casually multiply that by the €60 average market price, expected revenue would be:
€6,000.
But that is not what happened.
Let’s calculate what the plant actually earned.
At 10:00:
10 MWh × €100 = €1,000
At 11:00:
20 × €80 = €1,600
At 12:00:
40 × €40 = €1,600
At 13:00:
30 × €20 = €600
Total revenue:
€4,800.
Divide revenue by generation:
€4,800 / 100 MWh =
€48/MWh.
That:
€48/MWh
is the solar plant’s capture price.
The market averaged:
€60/MWh.
The solar plant captured:
€48/MWh.
Nothing mysterious happened.
The plant simply produced more electricity during the cheaper hours.
So what exactly is capture price?
Capture price is the generation-weighted average electricity price received by a power plant or generation technology over a given period.
ACER uses essentially this definition in its European electricity-market monitoring: capture price is the weighted average price a generation technology receives for its electricity in the market.
The formula is:
Capture price = Σ (Generation × Market price) / Σ Generation
That looks more intimidating than it is.
It simply asks:
During the hours when I generated electricity, what was the average price – weighted by how much I generated in each hour?
If you produced nothing during a €300/MWh evening price spike:
lovely price.
Not your price.
If you produced heavily during a €10/MWh sunny afternoon:
that hour matters a lot.
Capture price therefore connects:
production profile
to:
market price profile.
And that connection is where things get interesting.
Two generators can live in the same market and earn different prices
Imagine two plants.
Solar Farm Sunny
produces mostly between 09:00 and 17:00.
Hydro Plant Flexible
can choose when to release water and generate.
Both sell into exactly the same wholesale market.
Same bidding zone.
Same day-ahead prices.
Same currency.
Same electrons once they enter the grid.
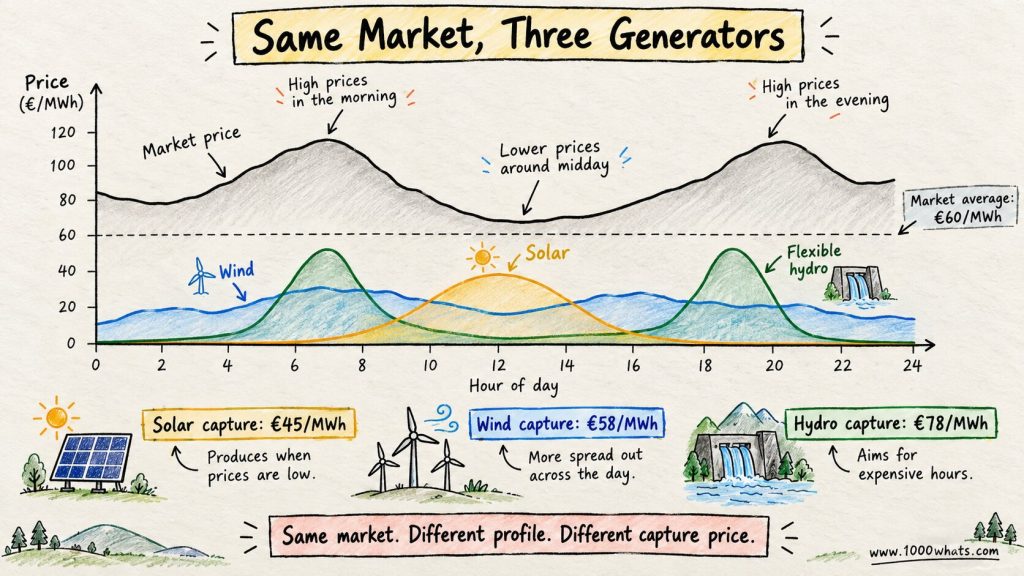
Yet their capture prices can be very different.
Why?
Because they do not sell at the same times.
Solar may produce heavily when midday prices are low.
Flexible hydro may preserve water and generate during expensive morning or evening hours.
The market is identical.
Their exposure to the market is not.
This is a fundamental electricity-market idea:
A MWh does not have one economic value. Its value depends on when it appears.
Location can matter too.
But today we are staying with time.
This is why solar creates its own problem
Solar has a remarkably inconvenient habit.
Solar plants in the same region tend to produce:
at the same time.
One sunny afternoon does not usually illuminate Solar Farm A while carefully avoiding Solar Farms B through Z.
So as more solar enters a market, something happens.
At noon:
solar production rises.
Low-marginal-cost electricity supply increases.
More expensive generators are pushed out of the merit order.
Wholesale prices fall.
Which means solar increasingly produces during hours when:
solar itself has helped make electricity cheaper.
This is often called:
price cannibalization.
We will give that concept its own article, because it deserves one.
For now, remember the mechanism:
more solar
↓
more electricity during sunny hours
↓
lower sunny-hour prices
↓
lower value of solar generation during those hours
↓
lower solar capture price
The technology is producing exactly when it is supposed to.
That is the problem.
⚡ “Renewables can reduce electricity prices so successfully that they begin reducing the value of their own next MWh.”
Wind does it too, just less politely
Wind generation is less tied to one predictable daily window.
But wind farms across a region can still have strongly correlated production.
When a large weather system brings strong wind across northern Europe, many wind farms may generate heavily at the same time.
Supply increases.
Prices weaken.
Wind capture price falls.
When wind production is scarce, prices may rise.
Unfortunately, the wind farm has less electricity to sell into those attractive prices.
Again:
production and price can become negatively correlated.
That relationship is the heart of capture-price risk.
It is not enough to ask:
What will the average electricity price be in 2035?
For a wind or solar project, you also need to ask:
What will electricity prices be during the hours when this project generates?
Those are not the same forecast.
Now meet the capture rate
Capture price is usually expressed in:
€/MWh
or another currency per unit of electricity.
But analysts often want to know how that compares with the general market.
So we calculate:
Capture rate = Capture price / Average market price
Using our earlier example:
Solar capture price = €48/MWh
Average market price = €60/MWh
Capture rate:
48 / 60 = 80%
The solar farm captured:
80% of the average market price.
If capture price equals average market price:
capture rate = 100%
If the generator tends to produce during above-average-price hours:
capture rate can exceed 100%.
If it produces disproportionately during cheap hours:
capture rate falls below 100%.
This is useful because it separates two different questions.
Market price: Is electricity generally expensive or cheap?
Capture rate: How favorable is this technology’s production profile relative to those prices?
That distinction becomes extremely useful when comparing markets or years.
A high market price can hide a bad capture rate
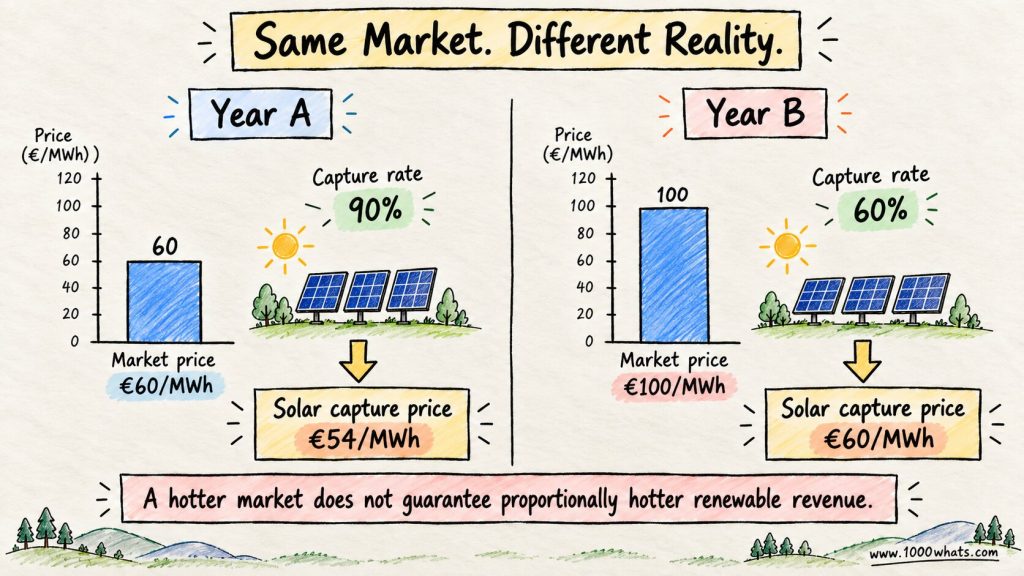
Suppose:
Year A
Average market price:
€60/MWh
Solar capture rate:
90%
Solar capture price:
€54/MWh
Year B
Average market price:
€100/MWh
Solar capture rate:
60%
Solar capture price:
€60/MWh
The wholesale market became dramatically more expensive.
€60 → €100.
Yet the solar capture price increased only:
€54 → €60.
Why?
Because solar’s production became much more concentrated in relatively cheap hours.
This is why saying:
“Power prices are expected to be €100/MWh”
can be dangerously incomplete in renewable-project economics.
The developer needs another number.
For my generation profile, how much of that €100 do I actually capture?
This is not theoretical
ACER’s market monitoring provides a useful European example.
Its calculations based on ENTSO-E data show that in 2024 the average capture prices across the analysed European generation mix were approximately:
- solar: €54.80/MWh
- wind: €60.90/MWh
- nuclear: €64.90/MWh
- coal: €98.80/MWh
- gas: €103.90/MWh
- pumped storage: €100.30/MWh
These are aggregated technology values, not prices every individual European plant received. Different countries, bidding zones and assets can have very different results.
But the pattern is revealing.
Generation technologies do not all experience the same electricity market in the same way.
ACER’s 2026 monitoring goes further and explicitly points to interconnection, storage and demand response as increasingly important for preventing low wind and solar capture prices.
That tells us something bigger.
Capture price is not merely a project-finance metric.
It is becoming a power-system metric.
Negative prices can make the effect brutal
Now suppose solar production is extremely high.
Demand is modest.
Export capacity is limited.
Storage is already full or insufficient.
Flexible demand is scarce.
Prices fall to:
-€20/MWh.
Your solar plant is producing beautifully.
Technically:
excellent day.
Commercially:
less festive.
My article on negative electricity prices explains why generators may sometimes face prices below zero.
For capture price, the important point is simple.
If negative prices occur disproportionately during high-solar or high-wind production periods, they carry a lot of weight in the calculation.
A -€20 hour when your plant produces nothing:
irrelevant.
A -€20 hour when your plant is at maximum output:
very relevant.
Capture price does not care about the drama of the price.
It cares about:
price × generation.
A solar project can have a great capacity factor and a terrible capture price
This is another distinction worth keeping.
My existing article on capacity factor asks:
How much electricity did the plant generate relative to what it could theoretically have generated at full output?
Capture price asks something completely different:
What was that electricity worth when it was generated?
Imagine two solar farms.
Solar Farm A
Excellent irradiation.
Capacity factor:
24%
Capture price:
€42/MWh
Solar Farm B
Weaker irradiation.
Capacity factor:
20%
Capture price:
€60/MWh
Which project is better?
Not enough information.
A produces more electricity per MW.
B earns more per MWh.
Now add:
CAPEX,
OPEX,
grid costs,
curtailment,
balancing costs,
taxes,
financing,
PPA structure.
Welcome to project economics.
One metric has once again refused to run the entire power station by itself.
This is also why LCOE is not enough
LCOE asks roughly:
What does it cost this plant to produce one MWh over its lifetime?
Useful.
But imagine:
Project A has an LCOE of €45/MWh
and capture price of:
€80/MWh.
Project B has an LCOE of €35/MWh
and capture price of:
€30/MWh.
Project B produces cheaper electricity.
Wonderful.
It is also selling that electricity for less than it costs.
The existing LCOE explainer already introduces the idea that electricity’s value depends on timing and system usefulness. Capture price gives us the market metric needed to make that timing visible.
This is why comparing technologies using only:
cost per MWh
can become misleading in systems with large shares of variable generation.
Cost matters.
Value matters too.
A project needs both sides of the equation.
Capture price matters enormously in PPAs
Now we arrive at the part that matters in actual commercial work.
Imagine a corporate buyer signs a solar PPA.
The solar project produces:
100 MWh at noon.
The buyer’s factory consumes:
100 MWh at 20:00.
On a monthly spreadsheet:
beautiful.
100 MWh produced.
100 MWh consumed.
Perfect match.
Except electricity markets do not settle annual PowerPoint symmetry.
They settle actual delivery periods.
At noon, solar electricity might be worth:
€30/MWh.
At 20:00, electricity might cost:
€120/MWh.
The volumes match.
The values absolutely do not.
This is:
profile risk.
And capture price sits right in the middle of it.
A buyer evaluating a renewable PPA therefore cannot simply compare:
PPA price
versus:
expected average wholesale price.
The generation profile matters.
The consumption profile matters.
The market price during both profiles matters.
And the contract decides who carries the difference.
My PPA explainer makes the broader point that a PPA allocates rather than eliminates risk. Capture-price risk is one of those pieces.
ACER’s 2025 PPA monitoring even notes that hybrid PPAs can improve wind capture rates in some markets.
That is not a decorative benefit.
It can change project revenue.
⚡ “A renewable PPA is not only a bet on how much electricity will be produced. It is also a bet on what that electricity will be worth when it arrives.”
Why solar plus battery changes the picture
Now return to our solar plant.
Without storage:
generate at noon.
Sell at noon price.
Suppose:
€20/MWh.
With a battery:
generate at noon.
Store some electricity.
Sell at 19:00.
Suppose:
€100/MWh.
The battery has changed the timing of delivery.
And timing was precisely what caused the low capture price.
This connects directly to article on energy arbitrage.
There, the battery saw low midday prices and high evening prices as an opportunity.
Here, the solar plant sees exactly the same price shape as a revenue problem.
Same market.
Different side of the spreadsheet.
Low solar capture price and battery arbitrage opportunity are often two views of the same price curve.
That is a useful connection.
The solar plant says:
Everyone is producing when I am producing, so my electricity is cheap.
The battery says:
Excellent. I’ll take some.
Hybrids can change the production profile itself
Storage is not the only option.
Suppose a project combines:
solar
and:
wind.
Solar production peaks during daylight.
Wind may have a different hourly and seasonal pattern.
Combine them and the generation profile can become less concentrated.
That can potentially improve:
connection utilization,
PPA matching,
and:
capture price.
But there is no universal rule saying hybrid = better capture price.
If the wind profile is highly correlated with already cheap market hours, it may not help much.
The answer depends on actual:
hourly production
and:
hourly prices.
This is why serious renewable valuation eventually becomes an hourly modeling exercise.
Annual averages are lovely.
Projects operate:
8,760 hours at a time.
Geographic diversification helps too
Now imagine every wind farm is located in one region.
Same weather system.
Same production pattern.
Same transmission constraint.
Same cheap hours.
Not ideal.
Spread generation across a wider geography and production patterns may become less correlated.
One region can be windy while another is calm.
Interconnectors can move surplus electricity toward markets where it is more valuable.
ACER’s 2026 market monitoring specifically highlights wider regional integration, interconnection, storage and demand response as ways to smooth renewable variability and support renewable market value.
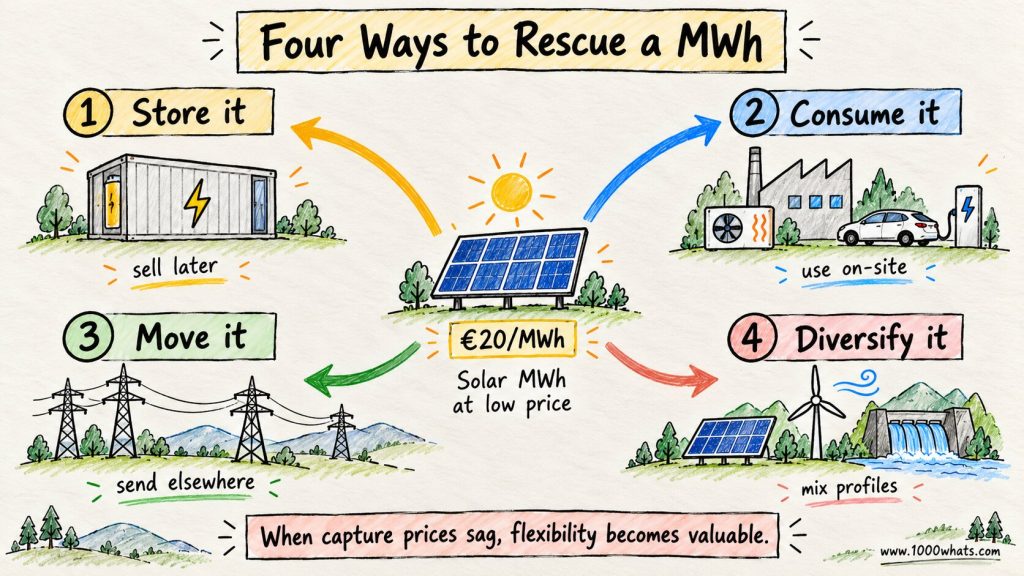
That gives us a useful hierarchy.
Low capture price can be improved by changing:
when electricity is delivered – storage;
when electricity is consumed – demand response;
where electricity can go – grids and interconnectors;
what produces it – hybridization and portfolio diversification.
The problem may appear on a generator’s revenue line.
The solutions can exist across the entire power system.
Can a generator have a capture rate above 100%?
Absolutely.
Imagine a hydro plant that can choose when to generate.
It waits during cheap hours.
Then electricity becomes scarce.
Prices rise.
The plant generates.
Its capture price can exceed the simple average market price.
Pumped storage is an even clearer example because its entire business model can revolve around moving energy from low-value hours toward high-value hours.
ACER’s historical data illustrate this nicely. In 2024, its aggregated capture-price dataset reports pumped storage at roughly €100.30/MWh, compared with €54.80/MWh for solar and €60.90/MWh for wind.
That does not mean pumped storage automatically earns more money overall.
It has pumping costs.
Efficiency losses.
Capital costs.
Operating constraints.
But it demonstrates the value of:
choosing when to sell.
Wind and solar mostly accept the weather’s schedule.
Flexibility gets to negotiate.
Capture price is not the same as realized project revenue
One final distinction.
Suppose a solar project’s capture price is:
€50/MWh.
Does that mean the project receives exactly €50/MWh?
Not necessarily.
It may have:
a fixed-price PPA,
a Contract for Difference,
a feed-in premium,
a floor,
a cap,
a hedge,
Guarantees of Origin,
balancing costs,
curtailment compensation,
or other contractual revenues and costs.
Capture price describes the market value of the generation profile.
Actual project revenue depends on the commercial structure wrapped around it.
That distinction matters.
A project may deliberately sign a PPA precisely because it does not want to live entirely with future capture-price uncertainty.
My existing article on price risk explains the wider family of market exposure.
Capture-price risk is a more specific creature.
It asks:
Even if I know the general level of electricity prices, what will prices look like during my actual production hours?
That question becomes increasingly important as renewable penetration grows.
And this is where cannibalization enters
We have carefully avoided treating:
capture price
and:
price cannibalization
as synonyms.
They are not.
Capture price is a metric.
It tells you the generation-weighted price received by a plant or technology.
Price cannibalization is a mechanism.
It describes how increasing output from a technology can depress prices during the same hours that technology produces, reducing its market value.
Capture price measures the result.
Cannibalization can help cause it.
That distinction deserves its own article.
Because once you understand capture price, the next question becomes almost unavoidable:
If solar keeps getting cheaper to build but more solar pushes solar-hour prices down, what happens to the economics of the next solar farm?
That is where the energy transition gets considerably more interesting than:
solar is cheap.
What is capture price in one sentence?
Capture price is the generation-weighted average market price a power plant or generation technology receives during the periods when it actually produces electricity.
But the better mental model is simpler.
Imagine two curves.
One shows:
electricity price.
The other shows:
your production.
Capture price tells you:
where those two curves actually meet.
That is the number your project cares about.
Not the annual price your market averaged while your plant was asleep.
Final thoughts
Electricity markets are full of averages.
Average annual price.
Average monthly price.
Average production.
Average capacity factor.
They are useful.
They are also capable of hiding the entire commercial story.
A solar project does not sell electricity at the annual average hour.
It sells when the Sun shines.
A wind farm sells when the wind blows.
A flexible hydro plant may wait.
A battery may deliberately buy during the worst hours and sell during the best ones.
Same electricity market.
Very different exposure.
That is why capture price matters.
It connects the physical profile of a power plant with the economic profile of the market.
And as wind and solar become larger parts of electricity systems, that connection becomes harder to ignore.
Cheap renewable electricity is an extraordinary achievement.
But building a technology cheaply and selling its output profitably are:
two different achievements.
The first question is:
What does my electricity cost to produce?
The second is:
What will the market pay when I actually produce it?
Capture price answers the second one.
And increasingly, that may be the more uncomfortable question.
Until next time, stay curious! 😎
Discover more from 1000whats
Subscribe to get the latest posts sent to your email.