

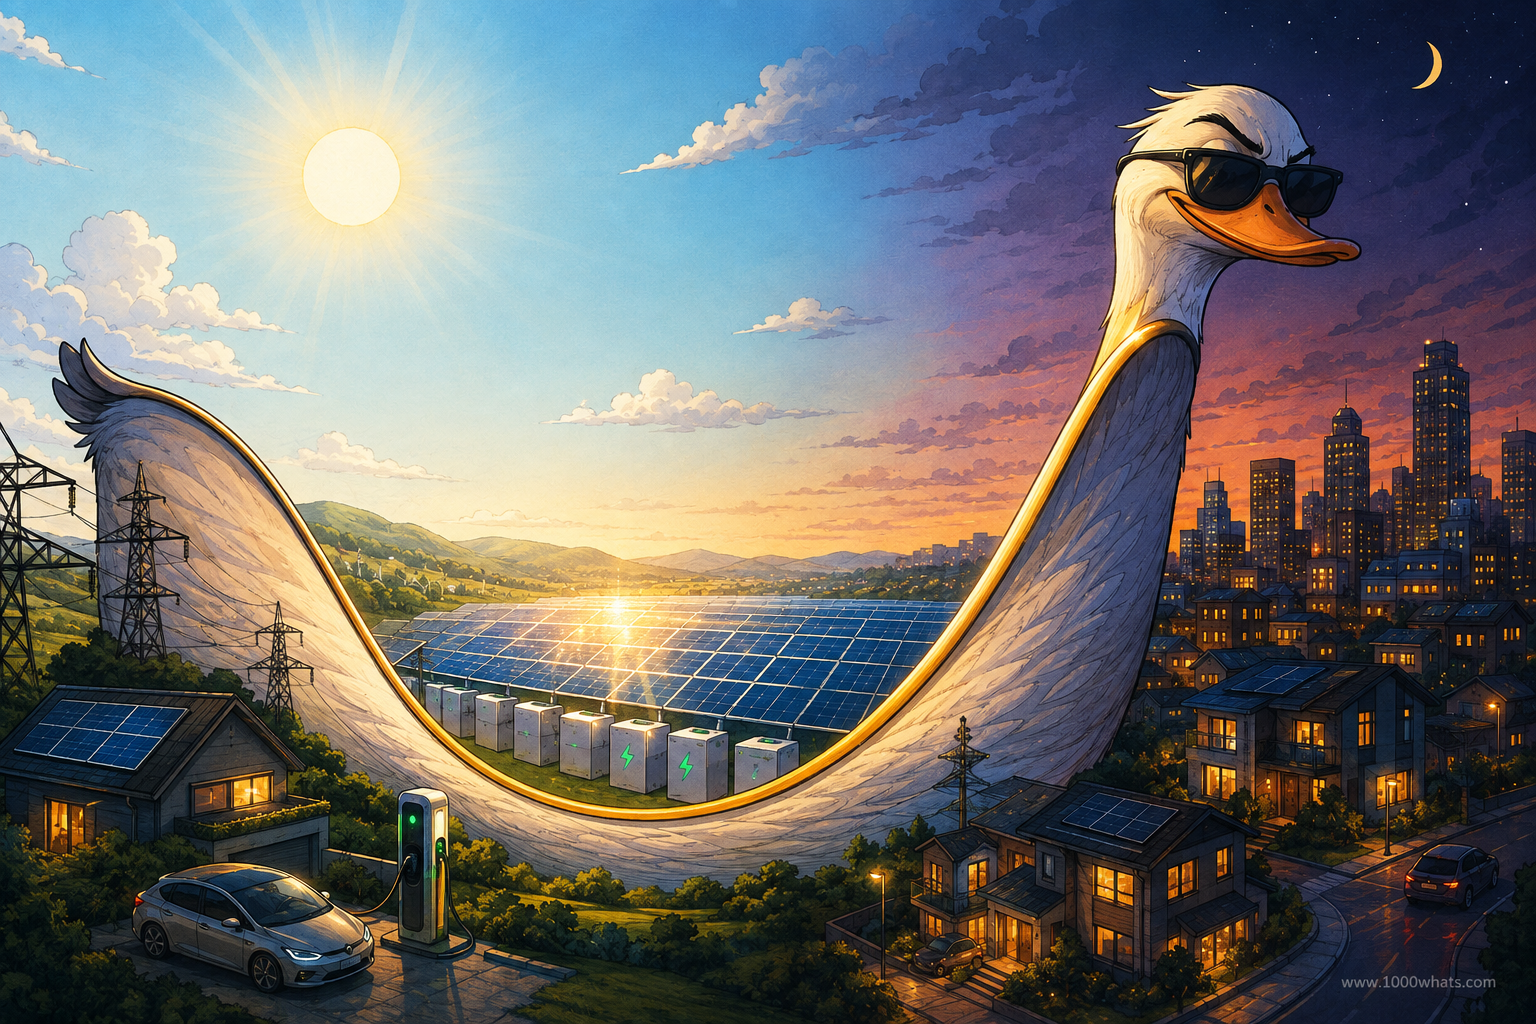
Solar power has a weird problem.
Sometimes, it works too well.
I know. That sounds like complaining your pizza has too much cheese or your vacation has too many beaches.
But electricity grids are strange creatures. They don’t just need energy. They need the right amount of energy at the right moment.
And when millions of solar panels start pumping electricity into the grid around lunchtime, something peculiar happens.
The amount of electricity conventional power plants need to provide falls dramatically.
Then the Sun begins to set.
Solar generation disappears.
People come home.
Lights switch on. Ovens heat up. Air conditioners keep humming. TVs wake from their afternoon nap.
Suddenly, the grid needs a huge amount of electricity from somewhere else—and it needs it fast.
Plot that pattern on a graph and, with a little imagination and perhaps one questionable lunch break at a grid operator’s office, it looks like a duck.
Hence one of the greatest names in energy economics:
The duck curve.
Yes. We have spent billions building one of the most sophisticated machines humanity has ever created, and one of its most important modern challenges is named after poultry.
Welcome to 1000whats.
Today, we’re going to quack this thing open.
What is a duck curve?
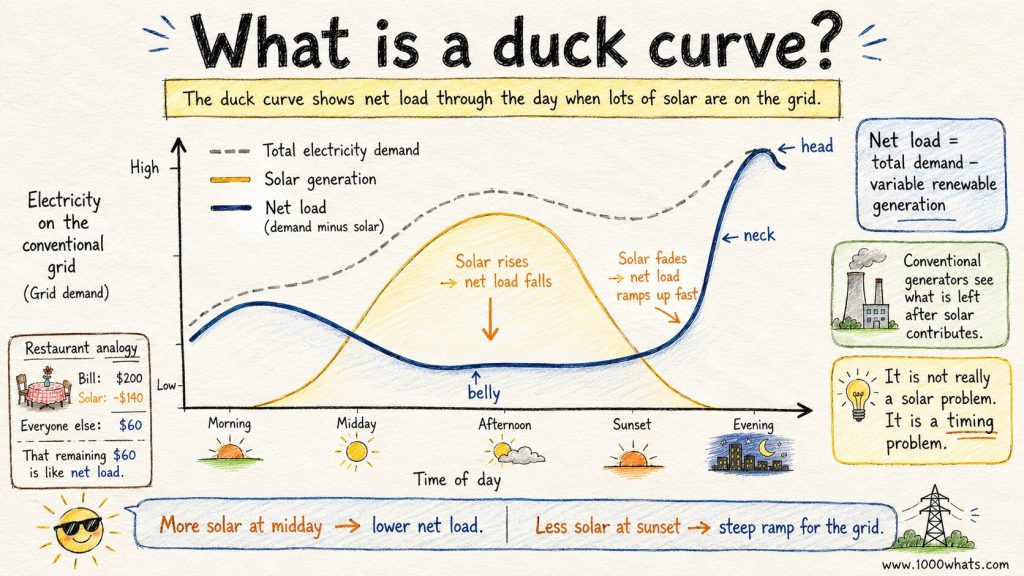
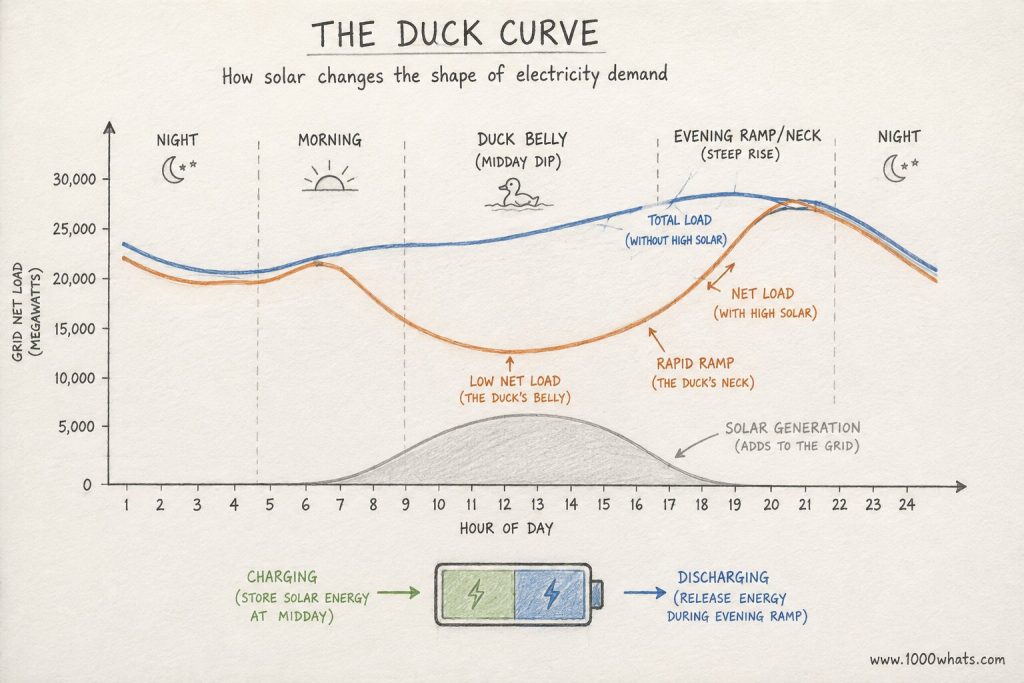
The duck curve is a graph showing how electricity demand from the conventional grid changes during the day when large amounts of solar power are present.
More precisely, it usually shows net load.
And that distinction matters.
Total electricity demand might be relatively high during the afternoon. But if solar panels are already supplying a huge chunk of it, conventional generators don’t see all that demand.
They see what is left.
Think of it like splitting a restaurant bill.
The table owes $200.
Solar leans over and says:
“I’ve got $140.”
Suddenly, everyone else only needs to find $60.
That remaining $60 is basically net load.
In electricity terms:
Net load = total electricity demand − variable renewable generation
When solar output rises around midday, net load falls.
When solar output collapses toward sunset, net load shoots upward again.
Plot that through the day and you get something resembling the belly, neck, and head of a duck.
Sort of.
You may need generous artistic standards.
⚡ “The duck curve isn’t really a solar problem. It’s a timing problem.”
Why does the duck curve exist?
The duck exists because the Sun and human electricity demand have never signed a scheduling agreement.
Solar panels follow sunlight.
People do not.
Solar generation usually begins climbing after sunrise, becomes strongest around the middle of the day, and then declines as evening approaches.
Electricity consumption follows a different rhythm.
Homes, offices, factories, shops, data centers, transportation systems, heating, cooling, and countless other loads create demand patterns that change hour by hour.
The trouble appears when solar generation becomes large enough to reshape what the rest of the power system sees.
Imagine a sunny spring day.
At 6 a.m., solar production is tiny.
By noon, thousands or millions of panels are producing electricity simultaneously.
By late afternoon, solar generation begins falling.
But household demand may be rising as people return home.
Suddenly, two things happen at almost exactly the wrong time:
solar supply falls while electricity demand rises.
That is where the duck gets its famous neck.
And that neck is where grid operators start paying very close attention.
How does the duck curve work?
Picture one ordinary day on the electricity grid.
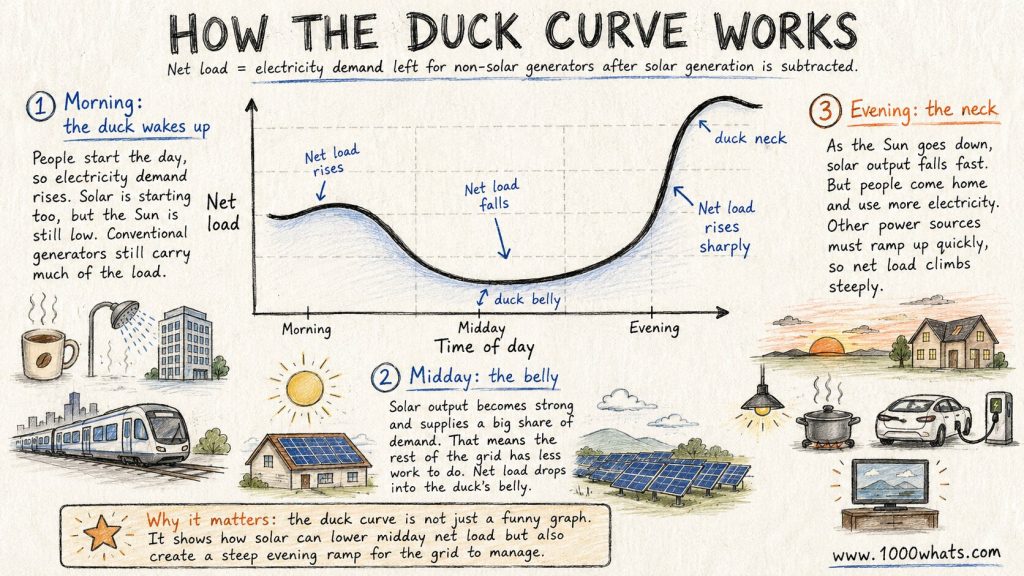
Morning: the duck wakes up
People get out of bed.
Coffee machines start bubbling. Showers heat up. Offices open. Trains move. Factories get busy.
Electricity demand rises.
Solar generation is beginning too, but the Sun is still relatively low.
Conventional generators still carry much of the load.
Nothing particularly duck-like yet.
Midday: welcome to the belly
Now the Sun gets serious.
Solar farms and rooftop systems begin producing large amounts of electricity.
That solar generation satisfies part of total demand, meaning the rest of the grid has less work to do.
Net load sinks.
The more solar capacity installed, the deeper this midday dip can become.
That deep section forms the belly of the duck.
And here is where things become counterintuitive.
A region can still be consuming enormous amounts of electricity while simultaneously experiencing very low demand for conventional generation.
Solar is quietly doing the missing work.
Evening: here comes the neck
Then sunset approaches.
Solar output falls—sometimes rapidly.
But electricity consumption doesn’t disappear with the sunlight.
Quite the opposite.
People arrive home.
Cooking begins.
Heating or cooling continues.
Lights come on.
EVs may get plugged in.
Entertainment systems wake up for their nightly shift.
The grid suddenly needs other electricity sources to replace disappearing solar generation while meeting evening demand at the same time.
Net load rises sharply.
That steep ramp creates the duck’s neck.
This is the part that makes the duck curve much more than a funny graph.
Why is the evening ramp such a big deal?
Power plants are not light switches.
You cannot necessarily take every generator from barely operating to full output instantly.
Different technologies have different operating characteristics.
Some generators can change output quickly. Others prefer steady operation. Some take considerable time to start. Others may become inefficient or expensive when constantly ramped up and down.
So when solar output drops rapidly, grid operators need enough flexible resources to replace it.
What most people don’t see is that electricity systems aren’t simply asking:
“Do we have enough power plants?”
They are also asking:
“Can those power plants, batteries, transmission lines, and flexible consumers respond quickly enough?”
That is a completely different question.
A grid could theoretically have plenty of generating capacity overall and still face operational headaches if too much of that capacity cannot move when the system needs it.
⚡ “In a solar-heavy grid, flexibility can become almost as important as generation itself.”
Wait—can there really be too much solar power?
Absolutely.
And this is where renewable-energy discussions get interesting.
People often imagine electricity generation like filling a swimming pool.
More electricity must be better, right?
Not necessarily.
The grid needs supply and demand to remain closely balanced.
If solar farms are producing huge amounts of electricity at noon but consumers aren’t using enough of it—and there isn’t enough storage, transmission capacity, or flexible demand available—the system may have surplus generation.
Electricity prices can fall dramatically.
In some wholesale markets, prices can even become negative.
And sometimes solar or other generators must be curtailed, meaning they are deliberately told to reduce output even though they could produce more.
Yes.
We build solar farms.
The Sun shines.
The panels work.
And then we occasionally tell them:
“Could you please stop being so productive?”
Electricity is weird.
Batteries: the duck’s worst nightmare
A battery can perform a beautifully simple trick:
Take electricity when the grid has too much of it and return it when the grid needs more.
Charge around midday.
Discharge during the evening ramp.
The duck’s deep belly becomes shallower.
Its steep neck becomes flatter.
Grid operators sleep a little better.
Battery storage is particularly well suited to daily solar shifting because the pattern repeats frequently: abundant solar electricity during daylight hours followed by stronger net demand after sunset.
In practice, this means solar and batteries increasingly behave less like separate technologies and more like partners.
Solar says:
“I made electricity at 1 p.m.”
Battery says:
“Great. I’ll sell it at 7.”
That’s not just storage.
That’s time travel for electrons.
Well, financially speaking.
Please don’t email a physicist.
But batteries aren’t the only solution
One of the biggest mistakes people make with the duck curve is assuming we need to solve the entire problem by building enormous warehouses full of batteries.
Storage helps enormously.
But the real goal is broader:
make the power system more flexible.
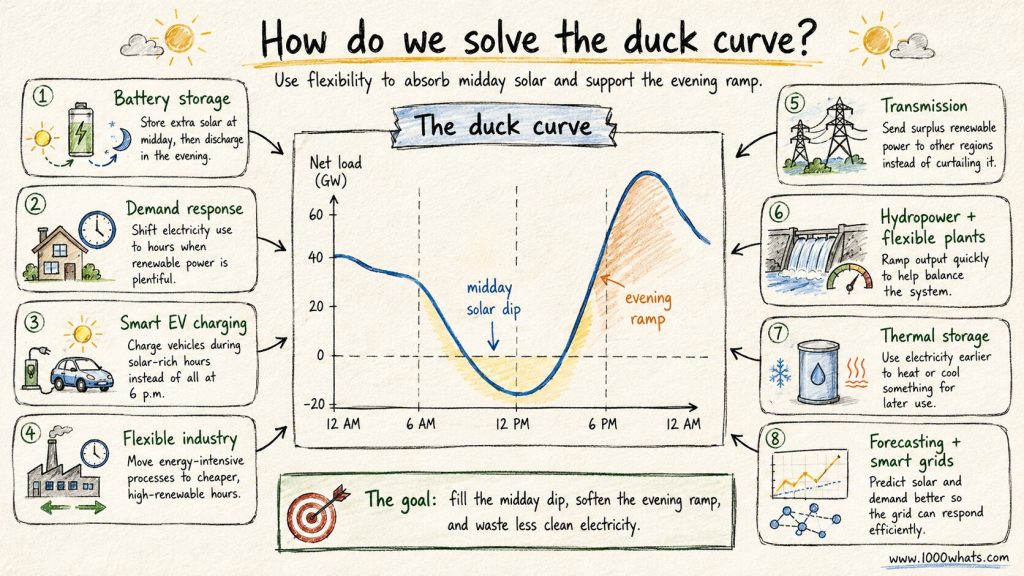
That can involve several tools working together:
- Battery storage: charge during periods of abundant solar generation and discharge during evening demand.
- Demand response: encourage consumers to move electricity consumption toward periods when renewable electricity is plentiful.
- Smart EV charging: instead of millions of vehicles automatically charging at 6 p.m., shift charging toward solar-rich hours where possible.
- Flexible industrial demand: move energy-intensive processes to times when electricity is abundant and inexpensive.
- Transmission: send surplus renewable electricity to regions that need it instead of curtailing generation locally.
- Hydropower and flexible generators: rapidly change output to help balance the system.
- Thermal storage: use cheap electricity earlier to heat or cool something that can deliver that energy later.
- Better forecasting and smart-grid controls: anticipate solar output and demand more accurately so resources can respond efficiently.
From a market perspective, this is where the energy transition becomes fascinating.
The first phase was largely about building cheap renewable generation.
The next phase is increasingly about making demand, storage, transmission, and electricity markets move around that generation intelligently.
Is the duck curve bad?
Not exactly.
Calling the duck curve “bad” is like calling a speedometer bad because it tells you you’re driving too fast.
The curve is a signal.
It reveals something fundamental about modern electricity systems: producing lots of cheap renewable electricity is only half the job.
You also need to make that electricity useful when and where people need it.
There are genuine challenges.
A deep duck curve can increase curtailment, pressure conventional generators to ramp more aggressively, complicate grid balancing, create volatile wholesale prices, and reduce the economic value of additional midday solar generation.
But the exact same curve also creates opportunities.
Cheap midday electricity can encourage batteries to charge.
EVs can absorb excess generation.
Industrial loads can shift toward inexpensive hours.
Flexible consumers can save money.
New market products can reward fast-ramping resources.
And storage developers suddenly have a business case staring at them in the shape of a waterfowl.
⚡ “The duck curve is what happens when renewable generation grows faster than the rest of the electricity system learns to dance with it.”
The duck curve changes the economics of solar
This part doesn’t get enough attention.
Suppose you build the first large solar project in a region.
It produces lots of electricity during the day, when that electricity may still be relatively valuable.
Excellent.
Now imagine thousands of megawatts of additional solar capacity arrive.
They all produce electricity at roughly the same time.
Suddenly everyone is trying to sell the same product during the same hours.
The midday electricity market gets crowded.
Prices fall.
Sometimes dramatically.
That means the economic value of another solar plant can decline even if the technology itself keeps getting cheaper.
This is one reason comparing electricity technologies only through generation cost can become misleading.
Cheap electricity that arrives when you already have plenty of electricity is not economically identical to electricity available during a tight evening peak.
Timing has value.
Flexibility has value.
Dispatchability has value.
And once renewable penetration gets high enough, those system characteristics become increasingly difficult to ignore.
What does the duck curve mean for consumers?
Probably more than you think.
The duck curve could eventually influence when electricity is cheapest, not just how electricity is generated.
Imagine a world where midday power is abundant because solar panels are flooding the grid.
Instead of treating electricity as something costing roughly the same throughout the day, consumers could respond to real system conditions.
Your EV charges at 1 p.m.
Your water heater stores heat at 2 p.m.
Your building precools itself before evening.
Your home battery fills during cheap hours.
Your dishwasher waits for solar-rich periods.
Individually, those actions look tiny.
Across millions of homes and businesses?
Now you’re reshaping the duck.
What most people don’t see is that consumers are slowly becoming part of grid infrastructure.
Smart appliances, EVs, rooftop solar, home batteries, dynamic tariffs, and automated demand response could turn electricity demand from something passive into something highly flexible.
Your future refrigerator may never understand the duck curve.
But its software might.
Can electric vehicles help flatten the duck curve?
Potentially, yes—and the scale could become enormous.
An electric vehicle is basically a large battery sitting unused for much of the day.
If millions of EVs charge immediately after their owners arrive home, they could make the evening ramp worse.
That would be wonderfully inconvenient.
But shift a meaningful portion of charging toward periods of high solar production and EVs become part of the solution.
Take things further with vehicle-to-grid technology, and some EVs could eventually send electricity back to the grid when needed.
Suddenly the car in your driveway isn’t merely transportation.
It’s a small mobile energy asset.
That is why the duck curve is ultimately about more than solar panels.
It is about coordination.
Will more solar make the duck curve worse forever?
Not necessarily.
If you keep adding solar without adding flexibility, the midday belly can deepen and the evening ramp can become more challenging.
But energy systems don’t stand still.
Storage grows.
Demand becomes more responsive.
Transmission expands.
Markets change.
EV charging becomes smarter.
Solar projects may increasingly be paired with batteries.
Other renewable technologies can complement solar generation profiles.
The shape of net demand changes with electrification too.
In other words, the duck curve isn’t destiny.
It’s feedback.
The grid is basically telling us where the next investment is needed.
Why the duck curve matters today
For decades, the big energy question was:
How do we generate enough electricity?
The clean-energy transition adds another:
How do we coordinate huge amounts of variable electricity?
That shift is important.
Installing renewable capacity is becoming increasingly normal.
Integrating it intelligently is the harder chapter.
The duck curve exposes the difference between cheap generation and a cheap electricity system.
Those are not always the same thing.
A solar panel can produce an extraordinarily inexpensive kilowatt-hour.
But the electricity system still needs transmission, storage, backup capacity, flexible demand, forecasting, balancing, and market rules capable of turning that kilowatt-hour into reliable electricity service.
That doesn’t make solar unattractive.
It makes electricity systems more interesting.
And much smarter.
Final thoughts
The duck curve has one of the silliest names in energy and one of the most serious messages.
It tells us that the clean-energy transition isn’t simply about replacing coal and gas plants with solar panels.
That would be the easy version.
The real challenge is building an electricity system capable of moving energy through both space and time.
Generate when the Sun shines.
Store what you don’t need.
Move power where it has value.
Shift demand when possible.
Keep flexible resources ready for the moments when renewable output changes.
Do that well, and the duck stops looking like a problem.
It starts looking like a roadmap.
In practice, that’s probably the biggest lesson hiding inside this strange little graph: the future of electricity isn’t just renewable. It’s flexible.
So, what do you think—will batteries finally flatten the duck, or will millions of EVs create an entirely new animal for grid engineers to name?
Until next time, stay curious! 😎
Discover more from 1000whats
Subscribe to get the latest posts sent to your email.
