Peak Demand

Learn what peak demand means, why it drives electricity costs higher, and how smart devices can help reduce it.

What is a load duration curve? The power grid fires its calendar

Load duration curve featured image showing electricity demand blocks being rearranged from a chronological profile into a descending ranked curve.

An electricity system can spend thousands of hours behaving nicely and a handful demanding everything at once. A load duration curve sorts those hours by demand, exposing the costly peak, the energy underneath, and the capacity that barely gets used. But it forgets when anything happened, which is why batteries eventually insist on rehiring the calendar.


What is diversity factor? The grid’s greatest scheduling trick

Diversity factor featured image showing apartments using electricity at different times for cooking, showering and EV charging while sharing one distribution transformer.

Four neighbors, four separate electricity peaks, and one transformer that refuses to panic. Diversity factor explains why the grid does not need to supply everyone’s personal maximum at once, how engineers calculate that advantage, and why synchronized EV charging or a heat wave can make the scheduling miracle disappear. The secret is not less electricity. It is better timing.

What is the Duck Curve? When solar power collides with peak electricity demand

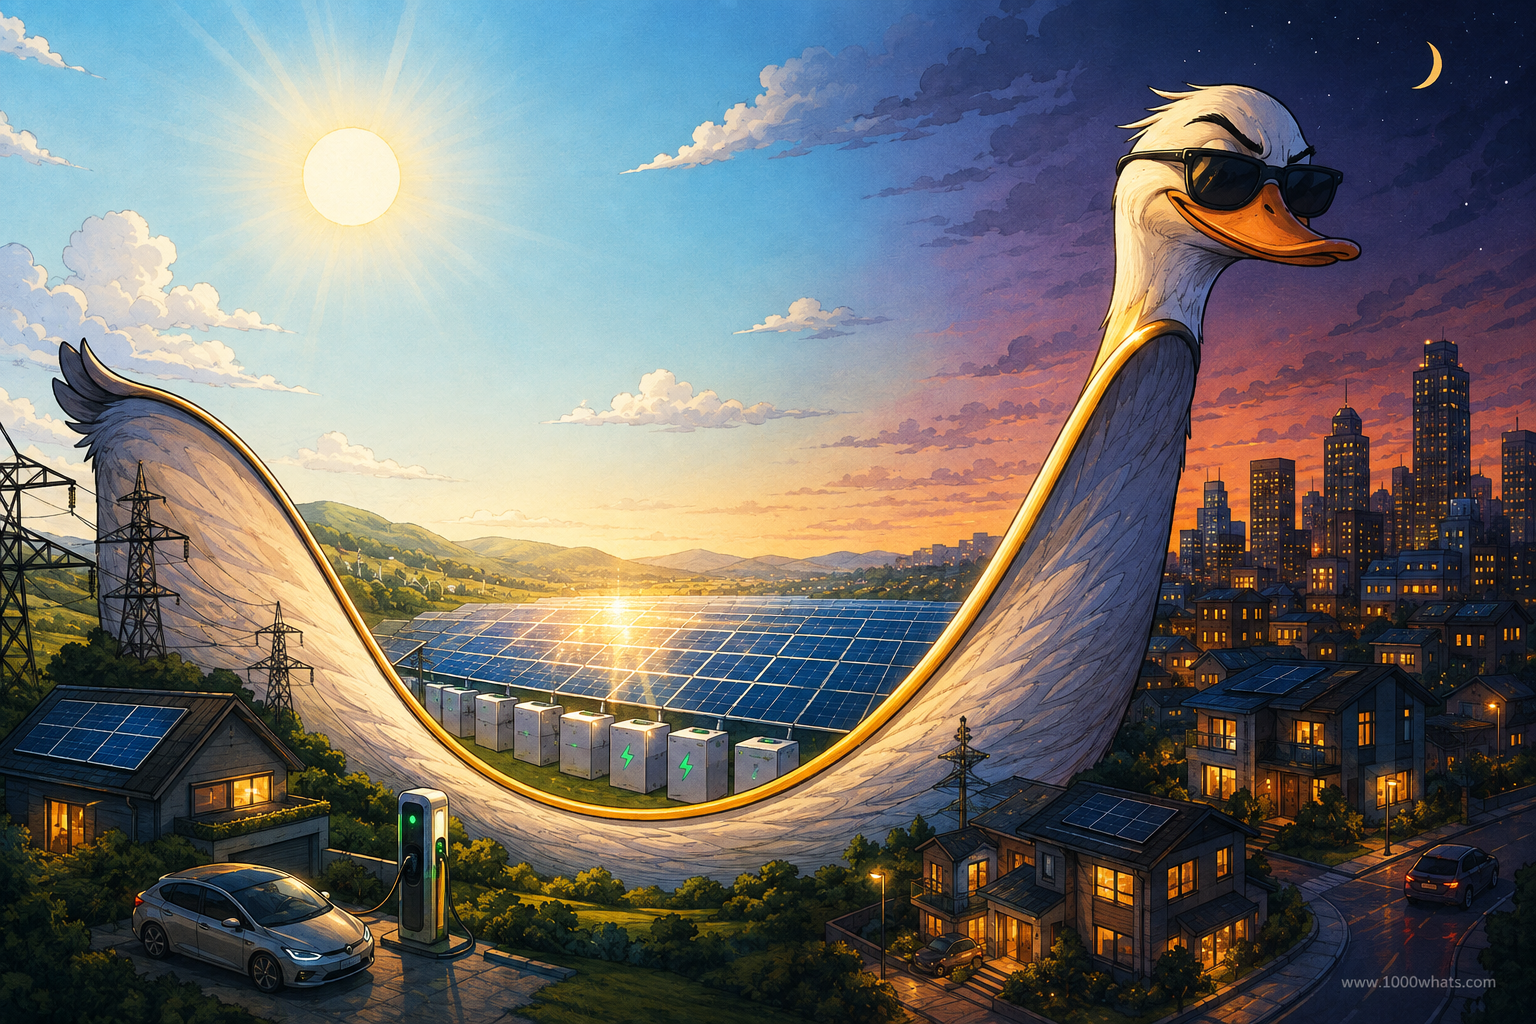
Witty featured image of the duck curve showing a giant duck-shaped figure over solar panels, batteries, homes, and an evening city skyline.

Solar power can become so abundant in the middle of the day that it creates a completely different problem for the electricity grid: too much power at noon, then a frantic scramble for electricity after sunset. That strange pattern is called the duck curve. Here’s what it is, why it happens, and why batteries, EVs, flexible demand, and smarter grids may finally teach the duck some manners.