
The applicant enters the room carrying a résumé printed on very expensive paper.
Across the top, in letters large enough to be seen from the parking lot: 100 MEGAWATTS.
“Impressive,” says the grid planner. “When can you work?”
“I have an excellent annual production record.”
“Lovely. Specifically, can you work at 7:12 p.m. on the coldest Thursday of the year, when three other generators have called in sick?”
“Well, that depends on the weather.”
The planner reaches for a different form.
Electricity systems are unusual employers. They cannot send the customers home when the staff fails to appear. They need enough power at the right moment, not merely an impressive total of megawatts on the company website. And the applicants have wildly different schedules: solar works daylight hours, wind is a talented freelancer, gas turbines need fuel and maintenance, and batteries are extremely punctual until their shift runs out.
This is the problem that capacity credit tries to solve. It gives the planner a way to compare resources by the contribution they make to keeping the lights on, rather than by the size of the number on the brochure.
Welcome to 1000whats, where today we are conducting the power system’s least glamorous job interview. The benefits are excellent. The attendance policy is brutal.
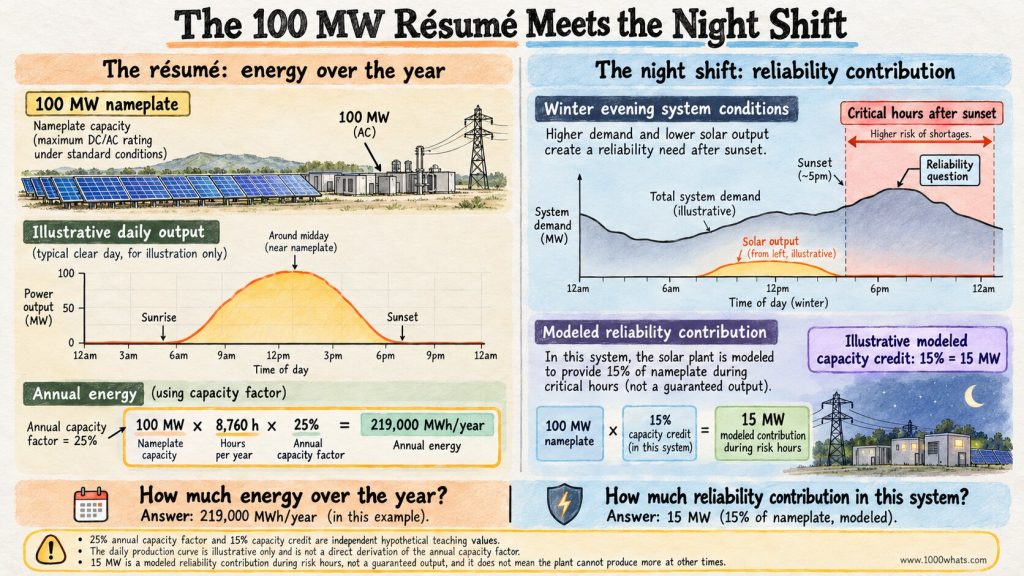
The résumé says 100 MW. The shift starts at 7 p.m.
A solar farm rated at 100 megawatts can, under suitable conditions, deliver roughly 100 MW of electrical power. That rating is its nameplate capacity. It describes the size of the machine, not a promise that the machine will deliver its rated output whenever someone asks.
At midnight, a perfectly healthy solar farm generally produces no electricity. It has not malfunctioned. It is simply operating under a fairly strict arrangement with the nearest star.
Capacity credit asks a different question: How much does this resource improve the power system’s ability to serve demand reliably?
The result is often expressed as an equivalent contribution in megawatts, or as a percentage of the resource’s nameplate rating. If a 100 MW resource is assigned a capacity contribution of 25 MW, its capacity credit is:
Capacity credit = 25 MW ÷ 100 MW × 100% = 25%.
Those 25 MW are not a forecast of what the plant will produce tomorrow. Nor are they a physical restriction on its output. The plant can still generate 100 MW when conditions permit. The 25 MW figure is an adequacy value derived from assumptions about the surrounding system and its reliability needs.
Think of a theater hiring musicians. A violinist who can play beautifully for 200 concerts a year is valuable. But if the orchestra needs a violinist for the one performance everyone has paid to see, availability on that particular evening matters rather a lot. The ticket office is unlikely to accept “I was magnificent last Tuesday” as a substitute.
Capacity credit is the grid’s attempt to value that particular kind of availability. For the wider question of whether the entire electricity system has enough dependable resources, see my guide to resource adequacy.
The interviewer is obsessed with the worst hours
Imagine a town whose electricity demand peaks at 6 p.m. on winter evenings. The local solar fleet produces wonderful amounts of electricity at noon. At 6 p.m., it produces considerably less. Some days, nothing at all.
The town still benefits from its solar power. It burns less fuel, buys less electricity from elsewhere, and may reduce emissions and operating costs. But a planner deciding how much additional dependable capacity the town needs cannot pretend that every noon megawatt will be available after sunset.
Now move the same solar farm to a region where the most dangerous reliability hours fall on sunny summer afternoons. Suddenly its timing looks much better. Same panels. Same nameplate. A much more attractive interview.
This is why capacity credit belongs to the system as much as to the individual plant. It depends on when demand is high, when other generators may fail, what weather patterns tend to occur together, how much storage exists, and which hours actually drive the risk of shortages.
It is not enough to circle the single highest-demand hour on a calendar. A system can be vulnerable during several kinds of event: a prolonged cold snap, a hot evening after solar output falls, or a week of low wind coinciding with equipment failures. The planner is interested in the hours when available supply comes uncomfortably close to demand, not merely the hours with the most dramatic electricity consumption.
And, yes, the grid keeps records. It has learned not to hire anyone based solely on a charming first impression.
Capacity factor and capacity credit are not the same employee
These two terms sound similar enough to share a desk. They should not share a spreadsheet cell.
Capacity factor measures how much energy a generator produces over a period compared with the energy it would produce if it ran at full nameplate power throughout that period.
Capacity credit measures how much the resource contributes to meeting a chosen reliability requirement. One is about total production over time. The other is about being useful when the system is at risk.
Take a hypothetical 100 MW solar plant with an annual capacity factor of 25%:
Annual generation = 100 MW × 8,760 h × 25% = 219,000 MWh.
That is 219 gigawatt-hours of real electricity. It can be extremely valuable. But it does not tell us how much dependable capacity the plant contributes.
Suppose a separate reliability study gives that plant a capacity credit of 15%. Its modeled adequacy contribution is then 15 MW, not 25 MW. The percentages differ because they answer different questions.
| Measure | What it asks | Illustrative result for a 100 MW solar plant |
|---|---|---|
| Nameplate capacity | How much power can the equipment deliver under rated conditions? | 100 MW |
| Capacity factor | What share of maximum possible energy did it generate over the year? | 25%, or 219,000 MWh/year |
| Capacity credit | How much dependable capacity does it contribute to this modeled system? | 15%, equivalent to 15 MW |
The 25% and 15% are illustrative assumptions, not universal solar values. Change the region, resource mix, reliability method, or year, and the result can change.
A person who has worked 2,000 hours this year has an impressive attendance record. That does not prove they can cover the overnight emergency shift. Your human resources department knows this. Power system planning has simply added considerably more probability theory.
How to run the interview: meet ELCC
One widely used way to estimate capacity contribution is effective load-carrying capability, or ELCC. The name sounds like something a committee designed to prevent outsiders from attending its meetings. The underlying idea is wonderfully direct.
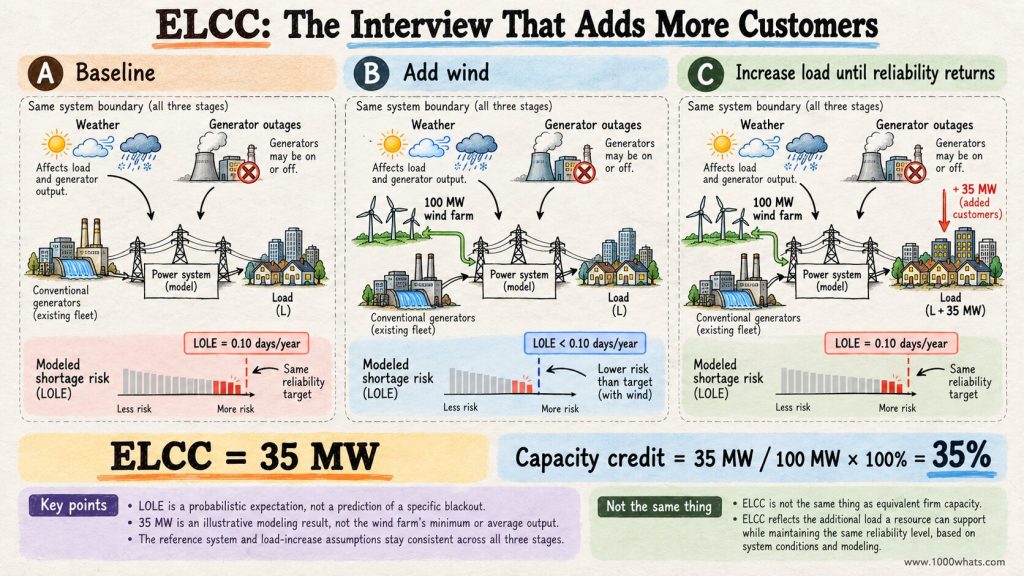
Start with a power system whose reliability you have modeled. Add a new resource. The system should now be better able to meet demand. Then ask how much additional demand it could serve before its reliability returned to the original level.
That additional load is the resource’s ELCC under the study’s assumptions.
Let’s interview a fictional 100 MW wind farm:
- Before the wind farm is added, the model estimates a loss-of-load expectation of 0.10 days per year.
- Add the wind farm, using realistic wind profiles and their relationship with demand and other resource outages. Modeled shortage risk falls.
- Increase the modeled load until the risk returns to 0.10 days per year.
- Suppose the model can support 35 MW of additional load. The wind farm’s ELCC is 35 MW, and its capacity credit is 35%.
We have not claimed that the wind farm will always produce at least 35 MW. We have claimed something subtler: in this model, adding the wind farm lets the system carry an additional 35 MW of specified load while preserving the same reliability metric.
The number is a statistical contribution, not a personal guarantee signed by the weather.
The Electric Power Research Institute’s explanation of resource accreditation describes this approach, alongside related methods such as equivalent firm capacity. The Probabilistic Resource Adequacy Suite documentation likewise distinguishes ELCC from other capacity-credit measures.
The probability department has terrible office hours
What does it mean to say a system has a loss-of-load expectation of 0.10 days per year?
It means the model expects the equivalent of one shortage day in ten years, averaged over many possible outcomes under its assumptions. It does not mean a blackout will arrive on a neatly scheduled Tuesday once every decade. And it does not specify how long each interruption lasts or how much electricity would be unserved.
Planners may also examine expected unserved energy, often expressed in MWh per year. That measure considers the expected quantity of electricity demand that cannot be met, not just the frequency of shortage events. Two systems can have similar shortage frequency and very different consequences.
A serious adequacy model may sample thousands of combinations of:
- hourly electricity demand and temperature;
- wind and solar output, including weather patterns that cover large regions;
- unexpected generator outages and planned maintenance;
- storage state of charge, charging opportunities, and operating limits;
- fuel availability, imports, and relevant network constraints.
The model is not predicting the exact date of the next emergency. It is asking how a fleet behaves across plausible emergencies. This is the difference between interviewing a candidate about one ordinary Tuesday and discovering whether the entire department can function when the office catches fire.
One caveat deserves a permanent place on the meeting-room wall: ELCC is not one uniquely fixed number independent of modeling choices. The chosen reliability metric, reference system, weather years, load-addition shape, and resource dispatch assumptions all matter. An ELCC calculated by adding constant load in every hour is not necessarily identical to one calculated for a particular new industrial load profile.
Solar: excellent at the day shift, less available after dark
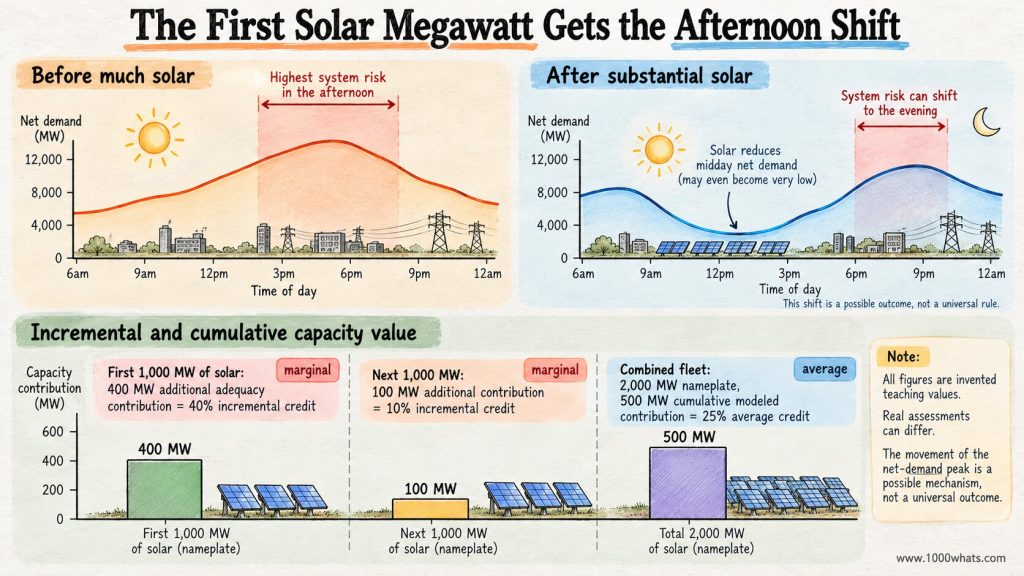
Early in a solar buildout, a region with strong afternoon air-conditioning demand may get substantial reliability value from solar panels. They generate when the system is straining. The interviewer is delighted.
Then the region installs more solar.
Midday electricity becomes plentiful. The most difficult hour moves later, toward the evening, when solar production is falling. Another identical solar farm still produces useful energy, but its additional contribution to meeting the newly critical hour may be smaller.
Nothing is wrong with the new panels. The job description changed while they were being installed.
That is the logic behind declining marginal capacity credit. As a system adds more of a resource with a similar production profile, each additional unit can contribute less to reliability than earlier units did. This is common with solar in systems where net peak demand shifts toward sunset, but the actual pattern depends on the grid.
The distinction matters because someone will eventually announce that solar has become “useless.” It has not. It may still generate large amounts of low-cost electricity and reduce fuel use. A lower capacity credit says something narrower: the next solar megawatt may do less to solve the system’s most difficult adequacy problem.
Capacity credit is a performance review for a specific job, not a verdict on an entire technology’s existence.
Wind: the talented freelancer with a weather-dependent calendar
Wind has a different schedule from solar. It can generate at night, during winter, and on days when the sun is taking a perfectly legitimate break. That makes it a potentially valuable complement.
But wind production is variable, and its timing is location-specific. A windy region may have strong winter production just when heating demand is high. Another region may experience extended periods of low wind during the same cold, high-demand weather systems that strain its other resources.
Averages can conceal that difference. If two wind farms have the same annual capacity factor, the one whose output better coincides with reliability-critical hours may have the higher capacity credit. Conversely, two geographically separated wind farms may not provide much diversity if the same large weather pattern suppresses both.
This is where a grid planner’s spreadsheet becomes a meteorological thriller. Not because the weather is mysterious, but because correlation matters. Ten turbines spread across a landscape are not ten independent dice rolls if they all experience the same calm afternoon.
To assess the real contribution, planners need weather and load data that preserve chronology and relevant geographic relationships. A bag of annual averages will not do. The grid cannot consume an annual average at 7:12 p.m.
Batteries: always on time, but how long is the shift?
The battery arrives early, wearing a name badge and carrying a stopwatch.
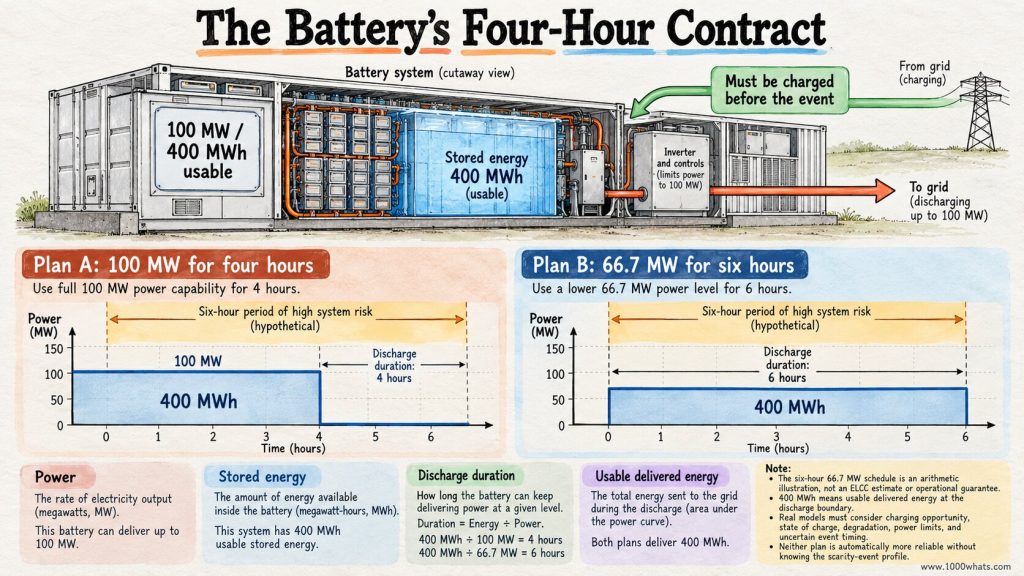
“I can deliver 100 MW,” it says.
“For how long?”
“Four hours, at rated usable energy.”
“And if we need six?”
There is a pause. The stopwatch becomes less reassuring.
Suppose a battery has a power rating of 100 MW and 400 MWh of usable stored energy. In an idealized discharge calculation, it can supply 100 MW for four hours, or an average of about 66.7 MW for six hours, assuming it begins fully charged and ignoring any additional operating constraints.
400 MWh ÷ 6 h ≈ 66.7 MW.
If the critical shortage lasts only two hours, this battery may be an excellent adequacy resource. If the shortage lasts through a long winter night, its energy limit becomes much more important. And if there was not enough electricity available to charge it beforehand, the beautiful 400 MWh specification offers little consolation.
That is why a battery’s capacity credit cannot be read directly from its MW rating or its advertised duration. It depends on the duration and timing of risky events, the charging schedule, efficiency, state-of-charge constraints, and what other resources are available.
There is a delicious irony here. Adding batteries can make the original short peak less dangerous, which can shift the remaining reliability risk toward longer events. The first batteries may be spectacular employees. Later ones are asked to work a longer shift for the same pay.
Research from Lawrence Berkeley National Laboratory illustrates how storage duration and penetration affect capacity contribution. For the mechanics of energy-limited storage, see my pumped-storage hydropower explainer.
The team interview: why solar and storage can be better together
Individually, solar and batteries have obvious weaknesses. Solar cannot move its production to midnight. Batteries cannot create the energy they later discharge.
Together, they can cover for each other.
Solar supplies daytime electricity that can help charge a battery. The battery can then discharge as the sun goes down, when demand net of solar generation may be highest. In a system where that evening transition creates reliability risk, the combination can be more useful than either resource considered alone.
But the word combination deserves some engineering supervision. A co-located solar-and-storage project might share an inverter or an interconnection limit. If the solar panels and battery both want to export at full power, the shared equipment may refuse to cooperate. Charging restrictions, round-trip losses, and battery dispatch priorities also affect the result.
Most importantly, capacity contributions are not always additive. You cannot necessarily take a solar plant’s separately calculated ELCC, add a battery’s separately calculated ELCC, and call the sum the portfolio’s ELCC. They change one another’s operating conditions and the system’s risk profile.
Two excellent job candidates do not automatically make an excellent team. One might need the office computer precisely when the other does. Or, in the happier version, one brings lunch and the other remembers the meeting time.
Good modeling evaluates the combined system, not merely the individual résumés stapled together.
Even the “dependable” applicants call in sick
It is tempting to assign every conventional power plant a capacity credit of 100% and reserve the difficult questions for wind, solar, and batteries. Conventional generators would enjoy that arrangement immensely.
Unfortunately, turbines break. Boilers need maintenance. Cooling water can become scarce or too warm. Gas supply can be constrained during extreme weather. Some plants cannot start quickly enough for the event in question. Others may be technically available but unable to deliver their full rated output under the conditions that matter.
Conventional plants often have relatively high capacity contributions because they can be dispatched when needed, provided they are available and have fuel. But dispatchable does not mean infallible. The proper accreditation reflects forced outages, deratings, common-cause risks, and other limitations relevant to the system.
A generator that is 95% available over the year does not automatically deserve a 95% ELCC. Outage timing, correlations, and the chosen method still matter. Annual availability is another useful résumé line, not a substitute for the interview.
The same principle applies to imports. A contract for 500 MW sounds reassuring until the neighboring region experiences the same heat wave and needs its own electricity. The grid’s best friend can still be busy on Friday night.
The next megawatt and the average megawatt are different people
Imagine a region with a small solar fleet. The first installations reduce shortage risk during sunny summer afternoons. They receive strong capacity credit.
After several gigawatts are installed, those afternoons are no longer the main problem. The remaining risk is concentrated in the evening. A new solar farm may add plenty of annual electricity but relatively little extra reliability value.
Now consider two ways to describe the fleet:
- Average capacity credit: the adequacy contribution attributed to the whole fleet divided by its total nameplate capacity.
- Marginal capacity credit: the additional adequacy contribution of the next increment of capacity, divided by that increment’s nameplate capacity.
For a deliberately simplified illustration, suppose the first 1,000 MW of solar adds 400 MW of adequacy value, and the next 1,000 MW adds only 100 MW. The combined 2,000 MW fleet has 500 MW of modeled value, giving an average credit of 25%. But the second increment’s marginal credit is only 10%.
| Illustrative solar addition | Added nameplate | Added adequacy value | Incremental credit |
|---|---|---|---|
| First tranche | 1,000 MW | 400 MW | 40% |
| Second tranche | 1,000 MW | 100 MW | 10% |
| Combined fleet | 2,000 MW | 500 MW total | 25% average |
These numbers are invented to teach the arithmetic, not extracted from a particular grid. In an actual study, the fleet’s contribution and the incremental contribution must be calculated consistently against defined reference systems; different allocation rules can produce different administrative credits.
The distinction between average and marginal capacity credit is important enough that national laboratory researchers publish separate datasets for them. The National Laboratory of the Rockies’ work on average and marginal capacity credit explores how these values vary by resource and system conditions.
In ordinary language: the first umbrella at a rainy bus stop is extremely useful. The hundredth umbrella is still an umbrella. Its marginal contribution to keeping everyone dry may be modest, particularly if the problem has moved from rain to wind.
A worked example: the planner’s hiring budget
Suppose a planning team wants to screen options for adding about 100 MW of accredited capacity. It has three hypothetical offers. To keep the arithmetic transparent, imagine the team has been given the following provisional accreditation factors for its particular system:
| Resource | Nameplate rating | Illustrative accreditation | Credited capacity |
|---|---|---|---|
| Solar | 300 MW | 15% | 45 MW |
| Wind | 100 MW | 25% | 25 MW |
| Four-hour battery | 50 MW / 200 MWh | 60% | 30 MW |
| Arithmetic total | 450 MW nameplate power | Not a meaningful combined percentage | 100 MW |
That table illustrates how planners convert equipment ratings into a common adequacy accounting unit. It does not prove that the three projects together provide exactly 100 MW of ELCC. A portfolio study may produce a different answer because solar, wind, storage, and system risk interact. The credited figures here are hypothetical screening inputs, not universal technology benchmarks.
It also does not mean 450 MW of equipment is somehow “worse” than 100 MW of conventional generation. The renewable plants may supply large amounts of energy across the year, while the battery provides flexibility and other services. Capacity contribution is only one item in a power system’s purchasing decision.
The planner is buying a workforce, not a single pair of hands. Someone must cover the difficult shift. Others can make the entire business cheaper and cleaner on every ordinary day.
There is a difference between being hired and getting paid
Capacity credit has consequences beyond an engineer’s spreadsheet. It can affect how much capacity a utility counts toward its planning requirement, how projects are evaluated in procurement, and, in some electricity markets, how much capacity a resource is eligible to sell.
But capacity credit is not an electricity price. A 30% credit does not mean a generator receives 30% of the energy price, or that 70% of its electricity is worthless. Energy-market revenue depends on actual generation and prices. Capacity-market revenue, where such a market exists, depends on market rules, accredited capacity, clearing prices, and performance obligations.
A 100 MW plant credited with 30 MW might still sell the electricity it actually generates, subject to dispatch and market rules. If it participates in a capacity market, its qualified capacity may be affected by that 30 MW accreditation and by additional unit-specific adjustments.
Nor is a lower capacity credit a universal argument for or against building a project. It is one input into a larger economic decision involving energy value, emissions, fuel exposure, flexibility, network costs, and system needs. My explanations of capture price and energy arbitrage explore other ways electricity resources earn their keep.
The job interview decides how much dependable coverage the applicant provides. Payroll is handled by another department. As in most large organizations, the two departments do not always use the same spreadsheet.
Five questions to ask before believing a capacity-credit number
If someone presents a single capacity-credit percentage without context, do not immediately accuse them of fraud. Ask five questions. Politeness is free, and sometimes the answer is perfectly defensible.
- Which power system? A sunny summer-peaking grid and a winter-peaking grid are not interviewing for the same position.
- Which reliability metric and method? ELCC, equivalent firm capacity, and simpler peak-period approximations are related but not interchangeable.
- Which year and resource mix? A figure calculated before a major solar or battery buildout may be a poor guide to the next project.
- Average or marginal? A fleet’s average contribution is not necessarily what the next megawatt adds.
- What constraints were modeled? Weather correlations, storage charging, forced outages, fuel, transmission deliverability, and operating limits can all change the answer.
A sixth question is often worth asking: is the number a physical reliability estimate or an administrative accreditation used by a particular market? The latter may incorporate rules, categories, adjustment factors, or seasonal conventions that make it different from a simple stand-alone ELCC calculation.
These are not nitpicks. They determine whether a percentage means something useful or is merely a very confident-looking number with nowhere to live.
Final thoughts
The most important question in electricity planning is not how many megawatts we have bought. It is whether enough useful megawatts will be there when the system needs them.
Capacity credit gives that question a numerical answer, with all the necessary qualifications about weather, outages, demand, storage duration, and the rest of the fleet. It helps explain why two equally large power plants can contribute differently to reliability, why the value of an additional solar farm can change as the grid evolves, and why a battery’s impressive power rating needs an equally honest conversation about hours.
It also reminds us that power systems need more than dependable capacity. They need affordable energy, flexible operation, workable networks, and technologies that complement one another. A good hiring manager builds a team rather than recruiting 400 copies of the same employee and hoping someone covers the night shift.
The next time a project announces “100 MW of new capacity,” admire the engineering. Then ask the question that makes the résumé meaningful: how much of that capacity can the system count on, and when?
Until next time, stay curious! 😎
Discover more from 1000whats
Subscribe to get the latest posts sent to your email.